Legend with both point and line in R
Categories:
Creating Effective R Legends with Both Points and Lines

Learn how to construct comprehensive legends in R plots that accurately represent both point markers and line types, enhancing data visualization clarity.
When creating plots in R, a well-designed legend is crucial for interpreting the visualized data. Often, you might need to represent different data series using both distinct point markers (e.g., for individual data points) and unique line types (e.g., for trends or fitted models). Standard legend() functions in R can sometimes make it tricky to combine these elements effectively. This article will guide you through various methods to create legends that simultaneously display both point symbols and line styles, ensuring your plots are both informative and aesthetically pleasing.
The Challenge of Combined Legends
The primary challenge arises because the legend() function in R typically expects either pch (point character) or lty (line type) arguments, but not always a straightforward combination that visually links a specific point style with a specific line style for the same legend entry. If you try to pass both pch and lty directly for each legend item, R might not render them as intended, or you might end up with separate legend entries for points and lines, which can be confusing. The goal is to have a single legend entry that shows both the point and the line associated with a particular data series.
flowchart TD
    A[Start Plotting] --> B{Need Combined Legend?}
    B -- Yes --> C[Identify Data Series]
    C --> D[Assign Unique PCH & LTY to each Series]
    D --> E[Use `legend()` with `pch` AND `lty`]
    E --> F{Does it look right?}
    F -- No --> G[Adjust `seg.len` or use `points()`/`lines()` in legend]
    F -- Yes --> H[Final Plot]
    B -- No --> I[Use standard `legend()` for points OR lines]
    I --> H
Decision flow for creating combined point and line legends in R.
Method 1: Using legend() with pch and lty Simultaneously
The most direct approach is to pass both pch and lty arguments to the legend() function. R is designed to handle this, but sometimes the default seg.len (segment length) might not be long enough to clearly show both the line and the point. You might need to adjust this parameter to ensure the line segment is long enough for the point to be visibly embedded within it.
# Sample Data
x <- 1:10
y1 <- x + rnorm(10, 0, 1)
y2 <- 2*x + rnorm(10, 0, 1)

# Plotting the data
plot(x, y1, type = "p", pch = 16, col = "blue",
     xlab = "X-axis", ylab = "Y-axis", main = "Combined Point and Line Legend")
lines(x, y1, col = "blue", lty = 1)

points(x, y2, type = "p", pch = 17, col = "red")
lines(x, y2, col = "red", lty = 2)

# Creating the legend with both pch and lty
legend("topleft",
       legend = c("Series 1 (Points & Line)", "Series 2 (Points & Line)"),
       col = c("blue", "red"),
       pch = c(16, 17), # Point characters
       lty = c(1, 2),  # Line types
       lwd = 2,        # Line width
       seg.len = 3)    # Adjust segment length for better visibility
Basic R code for creating a legend with both point and line styles.
seg.len parameter in the legend() function. A value of seg.len = 3 or 4 often provides a good balance, allowing both the line and the point to be clearly visible within the legend entry.Method 2: Advanced Customization with points() and lines() within legend()
For more fine-grained control or if the direct pch and lty combination doesn't yield the desired visual, you can use the legend() function's text.width and x.intersp parameters in conjunction with manually adding points and lines. This method is particularly useful when you want to draw the line and point separately within the legend box, or if you have very specific aesthetic requirements that the default pch and lty arguments don't fully satisfy.
# Sample Data (same as before)
x <- 1:10
y1 <- x + rnorm(10, 0, 1)
y2 <- 2*x + rnorm(10, 0, 1)

# Plotting the data
plot(x, y1, type = "p", pch = 16, col = "blue",
     xlab = "X-axis", ylab = "Y-axis", main = "Custom Combined Legend")
lines(x, y1, col = "blue", lty = 1)

points(x, y2, type = "p", pch = 17, col = "red")
lines(x, y2, col = "red", lty = 2)

# Create an empty legend first to get coordinates
# Use 'plot = FALSE' to prevent drawing, just get dimensions
leg_coords <- legend("topleft",
                     legend = c("Series 1", "Series 2"),
                     plot = FALSE,
                     text.width = strwidth("Series 1 (Points & Line)") * 1.5)

# Manually add lines and points to the legend area
# The 'x' and 'y' coordinates for drawing are derived from leg_coords

# For Series 1
lines(x = c(leg_coords$rect$left, leg_coords$rect$left + leg_coords$text.width * 0.2),
      y = rep(leg_coords$text$y[1], 2),
      col = "blue", lty = 1, lwd = 2)
points(x = leg_coords$rect$left + leg_coords$text.width * 0.1,
       y = leg_coords$text$y[1],
       pch = 16, col = "blue", cex = 1.2)

# For Series 2
lines(x = c(leg_coords$rect$left, leg_coords$rect$left + leg_coords$text.width * 0.2),
      y = rep(leg_coords$text$y[2], 2),
      col = "red", lty = 2, lwd = 2)
points(x = leg_coords$rect$left + leg_coords$text.width * 0.1,
       y = leg_coords$text$y[2],
       pch = 17, col = "red", cex = 1.2)

# Finally, draw the legend text
legend("topleft",
       legend = c("Series 1 (Points & Line)", "Series 2 (Points & Line)"),
       col = c("blue", "red"),
       lty = c(NA, NA), # Set lty/pch to NA to avoid default drawing
       pch = c(NA, NA),
       lwd = 2,
       bty = "n") # No box around the legend
Advanced legend customization by manually drawing lines and points.
Best Practices for Combined Legends
Regardless of the method you choose, adhering to best practices will ensure your legends are always clear and effective:
- Consistency: Ensure the
pch,lty, andcolused in the legend exactly match those used in the plot itself. - Clarity: Legend labels should be concise and descriptive. Avoid jargon where possible.
- Placement: Position the legend where it doesn't obscure important data points or trends. Common positions include 'topleft', 'topright', 'bottomleft', 'bottomright', or 'center'.
- Readability: Use appropriate font sizes and colors for the legend text so it's easily readable against the plot background.
- Minimalism: Only include necessary information in the legend. If a series is self-explanatory or not critical for interpretation, consider omitting it from the legend.
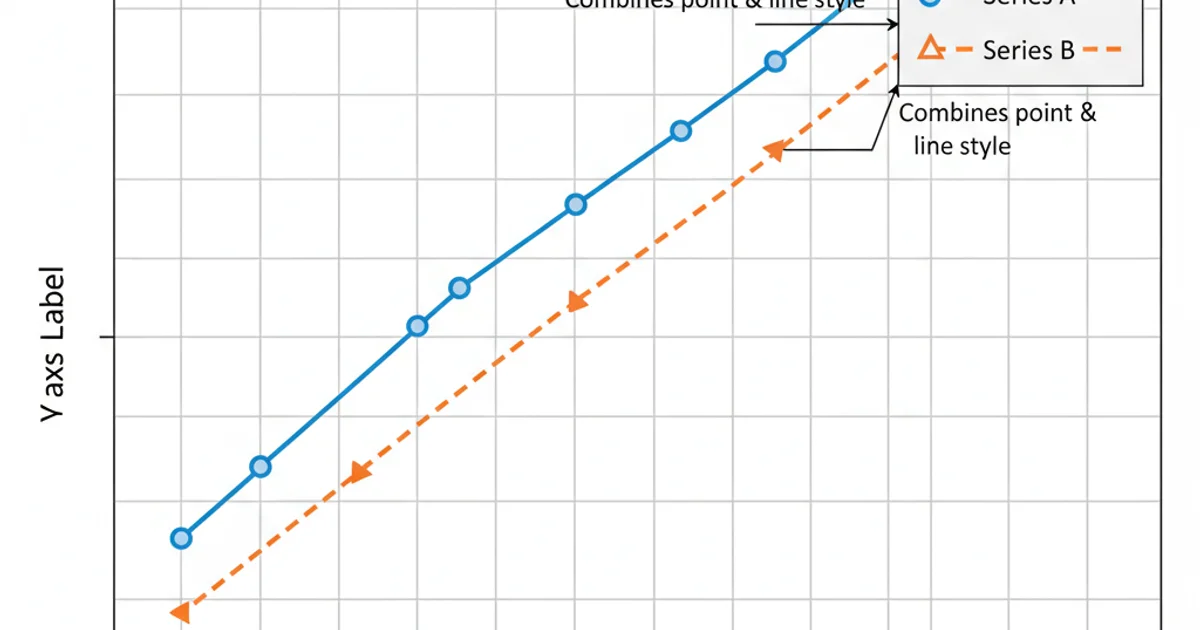
A well-structured legend showing both point and line styles for two data series.