MatLab--How would I generate an n-sided shape wher n >= 4
Categories:
Generating N-Sided Polygons in MATLAB

Learn how to programmatically create and visualize regular N-sided polygons (N >= 4) in MATLAB using fundamental geometric principles and vector operations.
Generating N-sided shapes, or regular polygons, is a common task in computational geometry, graphics, and various engineering applications. In MATLAB, you can achieve this by calculating the vertices of the polygon based on its center, radius, and the number of sides. This article will guide you through the process, providing a robust function that can generate any regular polygon with n >= 4 sides.
Understanding Regular Polygons
A regular polygon is a polygon that is equiangular (all angles are equal in measure) and equilateral (all sides have the same length). To define such a polygon, we typically need its center coordinates, a radius (distance from the center to any vertex), and the number of sides (n). The key insight is that the vertices of a regular polygon lie on a circumscribed circle. By dividing the circle's 360 degrees (or 2π radians) by the number of sides, we can find the angular separation between consecutive vertices.
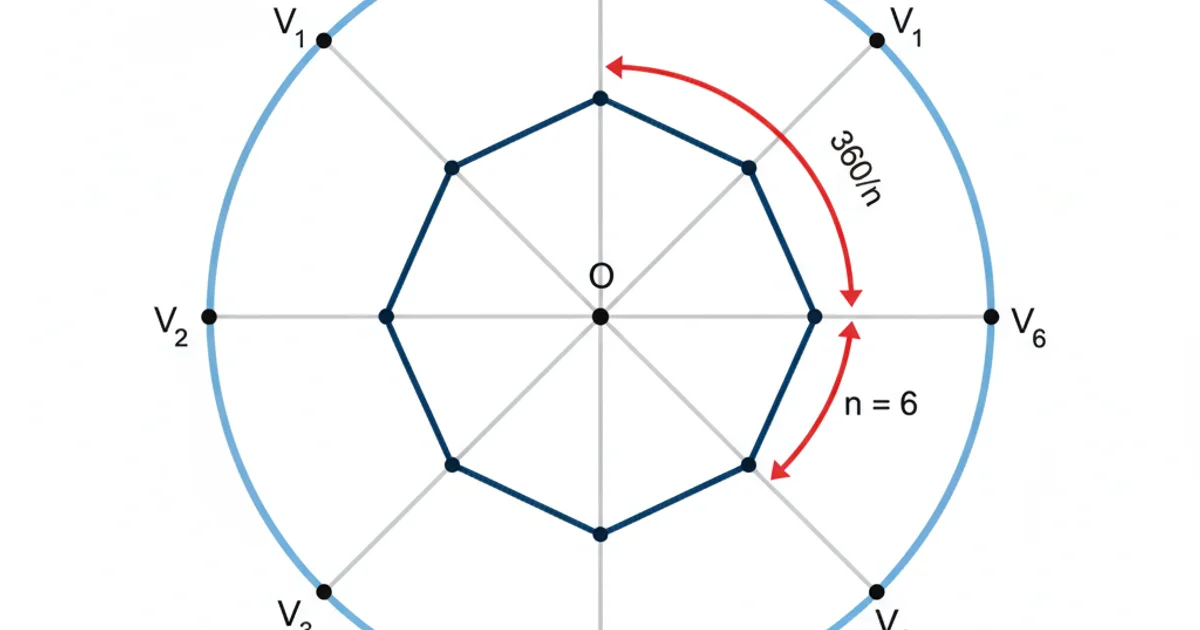
Geometric representation of a regular polygon's vertices on a circumscribed circle.
Calculating Polygon Vertices
To calculate the coordinates of each vertex, we can use trigonometric functions (cosine and sine). If the polygon is centered at (cx, cy) with a radius r, and has n sides, the k-th vertex (where k ranges from 0 to n-1) can be found using the following formulas:
x_k = cx + r * cos(theta_k)
y_k = cy + r * sin(theta_k)
Where theta_k is the angle for the k-th vertex. The angles are typically calculated as theta_k = initial_angle + k * (2 * pi / n). The initial_angle determines the orientation of the polygon; a common choice is 0 or pi/2 (to have one side parallel to the x-axis or y-axis, respectively).
function [x, y] = generatePolygon(n, center_x, center_y, radius, start_angle_rad)
% GENERATEPOLYGON Generates the vertices of a regular n-sided polygon.
%   [x, y] = generatePolygon(n, center_x, center_y, radius, start_angle_rad)
%   n: Number of sides (integer >= 4)
%   center_x, center_y: Coordinates of the polygon's center
%   radius: Distance from center to any vertex
%   start_angle_rad: Angle in radians for the first vertex (e.g., 0 for a vertex on positive x-axis)

    if n < 4
        error('Number of sides (n) must be 4 or greater.');
    end

    % Calculate angular step between vertices
    angle_step = 2 * pi / n;

    % Generate angles for each vertex
    angles = start_angle_rad + (0:n-1) * angle_step;

    % Calculate x and y coordinates for each vertex
    x = center_x + radius * cos(angles);
    y = center_y + radius * sin(angles);

    % To close the polygon for plotting, append the first vertex to the end
    x = [x, x(1)];
    y = [y, y(1)];
end
MATLAB function to generate polygon vertices.
start_angle_rad parameter is crucial for controlling the orientation of your polygon. For example, setting it to pi/2 (90 degrees) will orient a square such that one of its sides is parallel to the x-axis, rather than a vertex.Plotting the Polygon in MATLAB
Once you have the x and y coordinates of the vertices, plotting the polygon in MATLAB is straightforward using the plot function. By connecting the last vertex back to the first, you ensure a closed shape. The axis equal command is important to prevent distortion and ensure the polygon appears geometrically correct.
% Example Usage:

% Define polygon parameters
n_sides = 5; % Pentagon
center_x = 0;
center_y = 0;
radius = 2;
start_angle = pi/2; % Start with a vertex pointing upwards

% Generate vertices
[x_pentagon, y_pentagon] = generatePolygon(n_sides, center_x, center_y, radius, start_angle);

% Plot the pentagon
figure;
plot(x_pentagon, y_pentagon, '-o', 'LineWidth', 2, 'MarkerSize', 6);
hold on;

% Add another polygon: a square
n_sides_square = 4;
radius_square = 1.5;
start_angle_square = pi/4; % Orient square with a vertex on positive x-axis
[x_square, y_square] = generatePolygon(n_sides_square, center_x, center_y, radius_square, start_angle_square);
plot(x_square, y_square, '--s', 'LineWidth', 1.5, 'MarkerSize', 5);

% Add a hexagon
n_sides_hexagon = 6;
radius_hexagon = 2.5;
start_angle_hexagon = 0; % Orient hexagon with a side parallel to x-axis
[x_hexagon, y_hexagon] = generatePolygon(n_sides_hexagon, center_x, center_y, radius_hexagon, start_angle_hexagon);
plot(x_hexagon, y_hexagon, ':^', 'LineWidth', 1, 'MarkerSize', 4);

% Plot center point
plot(center_x, center_y, 'rx', 'MarkerSize', 10, 'LineWidth', 2);

% Customize plot
title(sprintf('Regular Polygons (N=%d, %d, %d)', 5, 4, 6));
xlabel('X-coordinate');
ylabel('Y-coordinate');
grid on;
axis equal; % Important for correct aspect ratio
legend('Pentagon', 'Square', 'Hexagon', 'Center', 'Location', 'best');
hold off;
Example script to generate and plot multiple polygons.
axis equal when plotting geometric shapes to ensure that the scaling of the x and y axes is the same. Without it, circles might appear as ellipses and squares as rectangles, distorting the visual representation of your polygon.1. Define Polygon Parameters
Choose the number of sides (n), the center coordinates (center_x, center_y), the radius (radius), and the desired start_angle_rad for the first vertex.
2. Calculate Angular Step
Compute the angle between consecutive vertices using angle_step = 2 * pi / n.
3. Generate Vertex Angles
Create a vector of angles for each vertex: angles = start_angle_rad + (0:n-1) * angle_step.
4. Compute Vertex Coordinates
Apply the trigonometric formulas x = center_x + radius * cos(angles) and y = center_y + radius * sin(angles).
5. Close the Polygon for Plotting
Append the first x and y coordinates to the end of their respective vectors to ensure the plot function draws a closed shape.
6. Plot in MATLAB
Use plot(x, y) and axis equal to visualize your generated polygon accurately.