Understanding the regress function in Matlab
Categories:
Mastering Linear Regression with MATLAB's regress Function
Explore the regress function in MATLAB for performing multiple linear regression, understanding its outputs, and interpreting the results for robust statistical analysis.
Linear regression is a fundamental statistical method used to model the relationship between a dependent variable and one or more independent variables. MATLAB provides a powerful function, regress, specifically designed for performing multiple linear regression. This article will guide you through the intricacies of regress, explaining its syntax, outputs, and how to interpret the results effectively to build accurate predictive models.
Understanding the regress Function Syntax
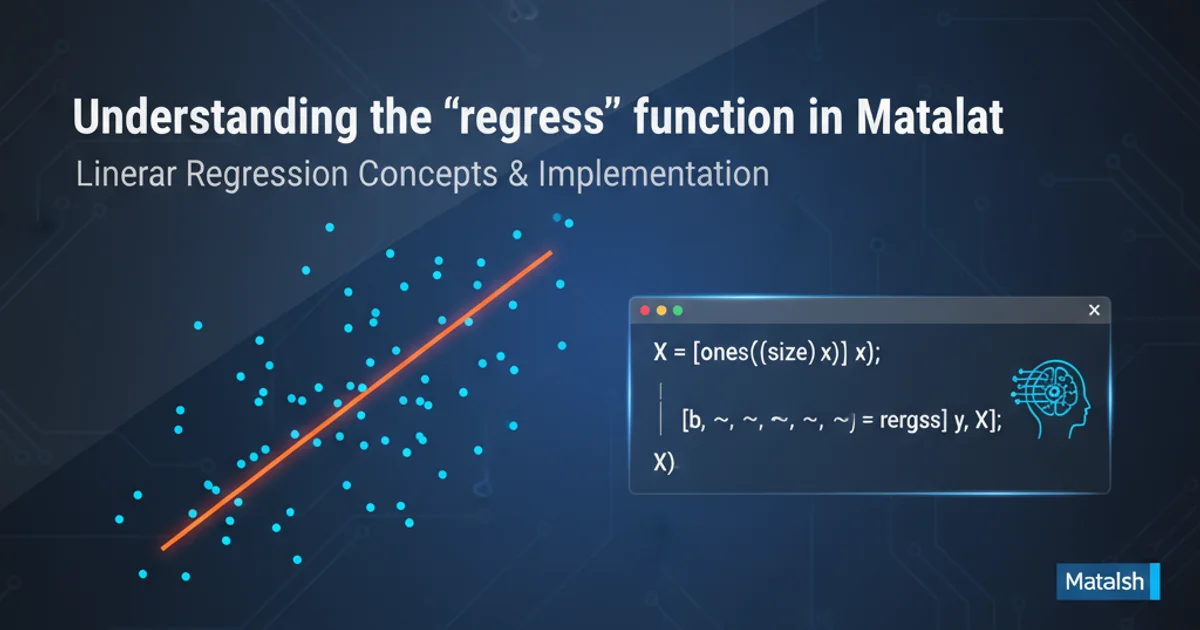
The regress function in MATLAB is highly versatile, allowing you to perform linear regression and obtain various statistical outputs. Its most common syntax is [b, bint, r, rint, stats] = regress(y, X), where:
y: A column vector representing the dependent variable.X: A matrix where each column represents an independent variable. It's crucial to include a column of ones inXfor the intercept term.
Let's break down the outputs:
b: A vector of estimated regression coefficients.bint: A matrix of 95% confidence intervals for the coefficients.r: A vector of residuals.rint: A matrix of 95% confidence intervals for the residuals.stats: A vector containing the R-squared statistic, F-statistic, p-value for the F-statistic, and the estimated error variance.
% Example: Simple Linear Regression

% Generate sample data
x = (1:100)';
y = 2*x + 5 + randn(100,1)*10;

% Prepare the design matrix X (add a column of ones for the intercept)
X = [ones(size(x)), x];

% Perform regression
[b, bint, r, rint, stats] = regress(y, X);

% Display results
fprintf('Estimated Coefficients (b):\n');
disp(b);
fprintf('95%% Confidence Intervals for Coefficients (bint):\n');
disp(bint);
fprintf('R-squared: %.4f\n', stats(1));
fprintf('F-statistic: %.2f\n', stats(2));
fprintf('p-value for F-statistic: %.4f\n', stats(3));

% Plot results
figure;
scatter(x, y, 'filled');
hold on;
plot(x, X*b, 'r-', 'LineWidth', 2);
xlabel('Independent Variable (x)');
ylabel('Dependent Variable (y)');
title('Linear Regression using regress');
legend('Data', 'Regression Line', 'Location', 'best');
grid on;
A basic example demonstrating how to use regress for simple linear regression and visualize the results.
Interpreting regress Outputs for Model Evaluation
Understanding the output values is key to evaluating your regression model. The coefficients (b) tell you the estimated change in the dependent variable for a one-unit change in the corresponding independent variable, holding others constant. The confidence intervals (bint) provide a range within which the true coefficient is likely to fall.
The stats vector is particularly important:
- R-squared (
stats(1)): Indicates the proportion of the variance in the dependent variable that is predictable from the independent variables. A higher R-squared value (closer to 1) suggests a better fit. - F-statistic (
stats(2)) and p-value (stats(3)): These are used to test the overall significance of the regression model. A small p-value (typically < 0.05) suggests that the model is statistically significant, meaning at least one independent variable has a non-zero coefficient. - Estimated error variance (
stats(4)): A measure of the variance of the residuals, indicating the spread of the data points around the regression line.
flowchart TD
    A[Start: Prepare Data] --> B{Include Intercept?}
    B -- Yes --> C[Add Column of Ones to X]
    B -- No --> D[Use X as is]
    C --> E[Call regress(y, X)]
    D --> E
    E --> F[Output: Coefficients (b)]
    E --> G[Output: Confidence Intervals (bint)]
    E --> H[Output: Residuals (r)]
    E --> I[Output: Residual Intervals (rint)]
    E --> J[Output: Statistics (stats)]
    J --> K[Interpret R-squared]
    J --> L[Interpret F-statistic & p-value]
    J --> M[Interpret Error Variance]
    F --> N[Evaluate Coefficient Significance]
    G --> N
    H --> O[Check for Residual Patterns]
    O --> P[End: Model Evaluation]
Workflow for using and interpreting MATLAB's regress function.
regress itself doesn't directly test for.Multiple Linear Regression Example
Let's extend our understanding to multiple linear regression, where we have more than one independent variable. The process remains largely the same, but the interpretation of coefficients becomes more nuanced as they represent the effect of one variable while holding others constant.
% Example: Multiple Linear Regression

% Generate sample data with two independent variables
x1 = (1:100)';
x2 = randn(100,1)*5;
y_multi = 3*x1 - 0.5*x2 + 10 + randn(100,1)*15;

% Prepare the design matrix X (add a column of ones for the intercept)
X_multi = [ones(size(x1)), x1, x2];

% Perform regression
[b_multi, bint_multi, r_multi, rint_multi, stats_multi] = regress(y_multi, X_multi);

% Display results
fprintf('Estimated Coefficients (b_multi):\n');
disp(b_multi);
fprintf('95%% Confidence Intervals for Coefficients (bint_multi):\n');
disp(bint_multi);
fprintf('R-squared: %.4f\n', stats_multi(1));
fprintf('p-value for F-statistic: %.4f\n', stats_multi(3));

% Interpretation:
% b_multi(1) is the intercept
% b_multi(2) is the coefficient for x1
% b_multi(3) is the coefficient for x2
An example of performing multiple linear regression with two independent variables.
vif function can help detect multicollinearity.