What does (idle) mean in Google Chrome DevTools Profiler?
Categories:
Understanding '(idle)' in Chrome DevTools Performance Profiler
Demystify the '(idle)' label in Google Chrome DevTools Performance tab and learn how to interpret it for optimizing web application responsiveness.
When profiling your web application's performance using Google Chrome DevTools, you'll often encounter various labels in the flame chart, such as 'Scripting', 'Rendering', 'Painting', and 'Loading'. Among these, the (idle) label can sometimes be a source of confusion. This article aims to clarify what (idle) signifies in the DevTools Performance profiler, why it's important, and how to leverage this information for better web performance optimization.
What Does '(idle)' Mean?
In the context of the Chrome DevTools Performance panel, (idle) refers to periods when the browser's main thread is not actively performing any significant tasks related to your web page. This means it's not executing JavaScript, performing layout calculations, painting pixels, or processing network requests for the current page. Essentially, the browser is waiting for something to happen, such as user input, a timer to fire, or a network response to arrive.
flowchart TD
    A[Browser Main Thread] --> B{Is there work to do?}
    B -->|Yes| C[Execute JavaScript]
    C --> D[Perform Layout]
    D --> E[Paint Pixels]
    E --> B
    B -->|No| F["(idle)" - Waiting for input/events]
    F --> B
Simplified browser main thread activity flow, illustrating when the browser enters an idle state.
Why Is '(idle)' Important?
While (idle) might sound like a good thing – less work means faster, right? – its significance depends on the context. Understanding (idle) periods is crucial for several reasons:
- Responsiveness: Long periods of
(idle)after a user interaction might indicate that your application is not providing immediate feedback, leading to a perceived lag. Conversely, if your application is constantly busy and rarely idle, it might be unresponsive. - Resource Management: Excessive
(idle)time when the user expects activity could point to inefficient polling mechanisms or unnecessary delays in fetching data. - Long Tasks and Jank: If you see short bursts of
(idle)interspersed with very long tasks, it means the browser is struggling to keep up, leading to a 'janky' user experience. Ideally, you want to break down long tasks into smaller, more manageable chunks that allow for frequent(idle)periods, enabling the browser to respond to user input. - Background Work: Sometimes,
(idle)periods are intentionally used by the browser or your application to perform low-priority background tasks, such as garbage collection or pre-fetching resources, without impacting the user experience.
(idle) can mean an unresponsive UI, while too much (idle) in critical moments might indicate a slow-loading or unresponsive application. The key is to have (idle) periods when the user is not actively interacting with the page, allowing the browser to be ready for the next input.Interpreting '(idle)' in Your Performance Profile
When analyzing your performance profile, consider the following:
- During Page Load: If you see significant
(idle)time during the initial page load, it might indicate that your page is waiting for network resources (e.g., large images, external scripts) to download, or that there are long periods where the main thread is blocked by a single, large task. Investigate the network tab or look for long-running script evaluations. - After User Interaction: Short
(idle)periods after a user clicks a button or types into an input field are good, as they mean the browser quickly processed the event and is ready for the next one. Long(idle)periods here might suggest that your event handlers are delayed or that subsequent UI updates are taking too long to initiate. - Between Animations/Updates: For smooth animations, you want to see consistent, short
(idle)periods between animation frames. This allows the browser to hit 60 frames per second (fps). If(idle)is absent or very short, it means the browser is struggling to render frames, leading to dropped frames and jank.
To effectively interpret (idle) periods, always correlate them with other events in the timeline, such as network requests, user input events, and rendering updates. The goal is to ensure that the browser is busy with meaningful work when it should be, and idle when it can afford to be, without negatively impacting user perception.
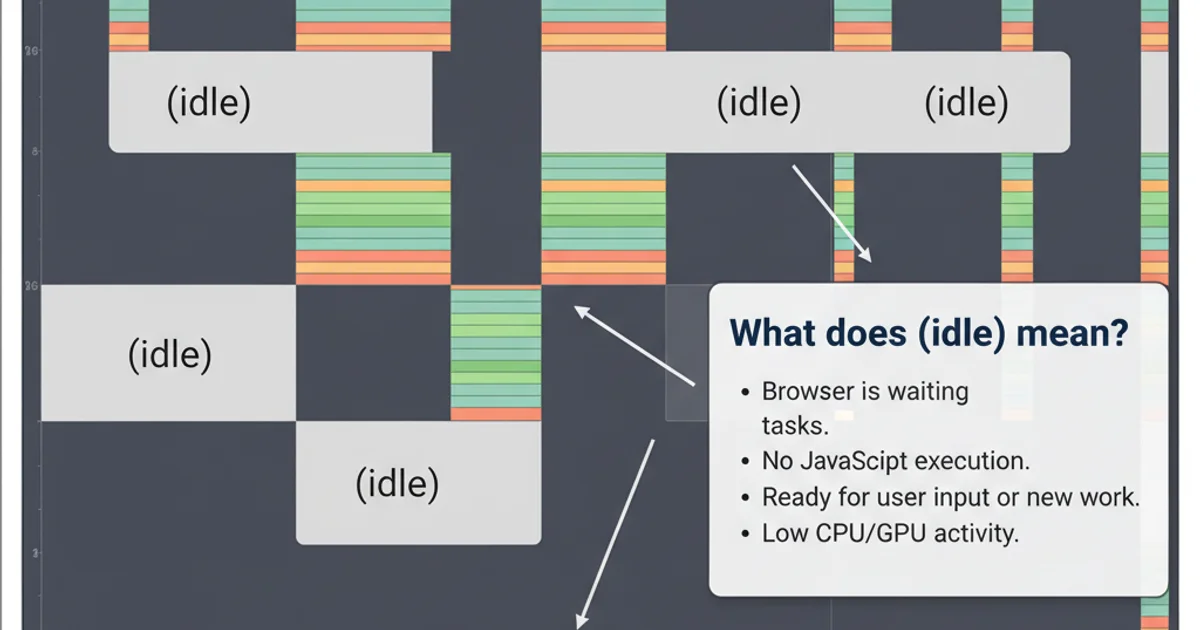
A typical Chrome DevTools Performance flame chart, highlighting periods of (idle) activity.