Reading debug information from DOS MZ executable
Categories:
Unveiling the Past: Reading Debug Info from DOS MZ Executables
Explore the structure of DOS MZ executables and learn how to extract valuable debug information, including symbol tables and line numbers, crucial for reverse engineering and historical software analysis.
In the realm of vintage computing and reverse engineering, understanding the internal structure of executable files is paramount. DOS MZ executables, prevalent in the MS-DOS era, often contain embedded debug information that can be a goldmine for developers and researchers. This article delves into the specifics of how debug symbols and line numbers were stored within these executables, focusing on the formats used by tools like Borland Turbo Assembler (TASM) and Turbo Debugger (TD).
The MZ Executable Structure and Debugging
The MZ executable format, named after the initials of Mark Zbikowski, was the standard executable format for MS-DOS. While simple, it allowed for various extensions, including the embedding of debugging information. Unlike modern formats like PE or ELF, there wasn't a single, universally standardized debug format. Instead, compilers and assemblers often used proprietary or semi-standardized structures appended to the executable. For TASM, this typically involved a specific debug record format that Turbo Debugger could interpret.
flowchart TD
    A[DOS MZ Executable] --> B{MZ Header}
    B --> C[Program Code & Data]
    C --> D{Optional Debug Information}
    D --> E[Symbol Table]
    D --> F[Line Number Info]
    D --> G[Source File Paths]
    E --"References"--> C
    F --"Maps to"--> C
Simplified structure of a DOS MZ executable with embedded debug information.
The debug information, when present, is usually located at the end of the executable file, after the main program code and data. It consists of several components, including symbol tables (mapping addresses to function/variable names), line number information (mapping code addresses to source file lines), and sometimes even source file paths. Extracting this data requires parsing the executable and understanding the specific debug record format used by the tool that generated it.
TASM's Debug Information Format
Borland's Turbo Assembler (TASM) and its accompanying Turbo Debugger (TD) were popular tools for DOS development. When TASM generates an executable with debugging enabled (e.g., using the /zi or /z switch), it appends debug records. These records are not part of the standard MZ header but are custom structures that TD knows how to parse. The key to reading this information is identifying the debug signature and then iterating through the various record types.
; Example TASM assembly code with debug info enabled
.MODEL SMALL
.STACK 100h
.DATA
    message DB 'Hello, Debug World!', 0Dh, 0Ah, '$'
.CODE
start:
    MOV AX, @DATA
    MOV DS, AX

    MOV AH, 9
    LEA DX, message
    INT 21h

    MOV AH, 4Ch
    INT 21h
END start
A simple TASM program that, when assembled with /zi, will contain debug information.
Parsing Debug Records: A Conceptual Approach
To programmatically read debug information, you would typically follow these steps:
- Locate the Debug Signature: Search for a specific byte sequence or signature at the end of the executable that indicates the presence and type of debug information. For TASM/TD, this might be a specific magic number or a pointer within a custom header.
- Identify Debug Header: Once the signature is found, parse a small debug header that usually contains offsets and sizes for the various debug sections (e.g., symbol table offset, line number table offset).
- Parse Symbol Table: Read the symbol table, which is a list of records. Each record typically contains a symbol name (e.g., function name, variable name), its type, and its memory address.
- Parse Line Number Table: Read the line number table. This table maps specific code addresses to their corresponding source file and line number. This is crucial for source-level debugging.
- Handle Source File Information: Some debug formats also embed the names or paths of the source files, allowing the debugger to locate and display the original source code.
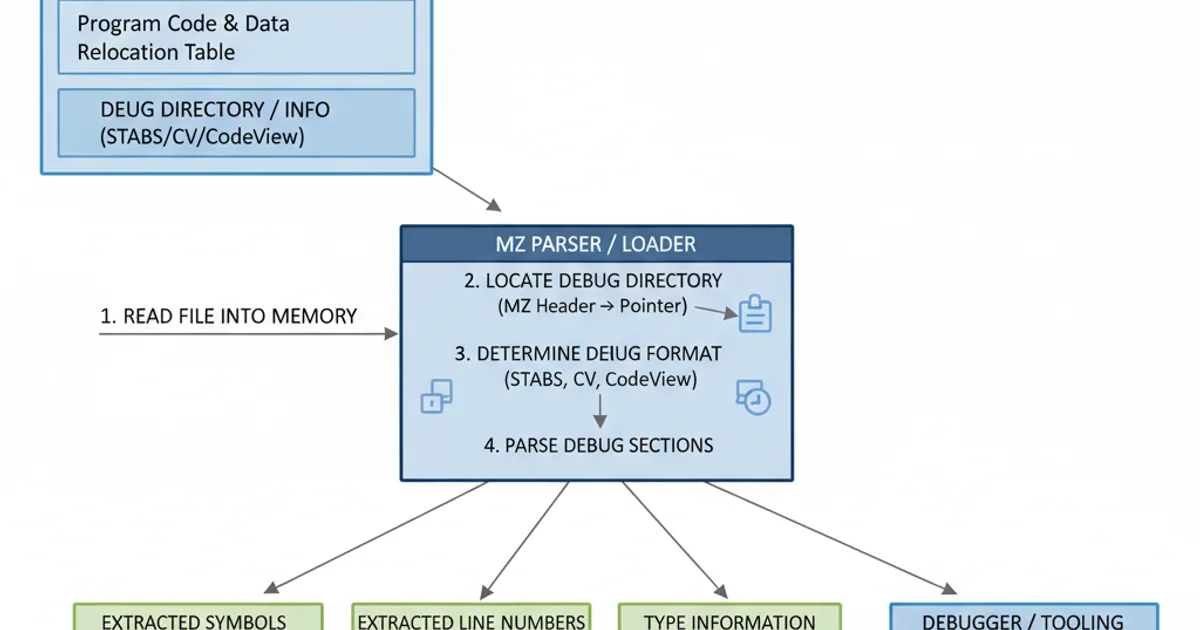
Conceptual flow for extracting debug information from a DOS MZ executable.
The exact byte-level structure of these records is often undocumented publicly and requires reverse engineering the debugger itself or consulting historical documentation. However, understanding the general components helps in building a parser. Tools like objdump or specialized DOS debuggers can sometimes provide insights into these structures, even if they don't directly support the specific format you're targeting.