How to put labels on tiles in ggplot2 in R?
Categories:
How to Add Labels to Tiles in ggplot2 in R

Learn various methods to effectively label tiles in ggplot2 heatmaps and treemaps, enhancing data visualization and interpretability.
Adding labels to tiles in ggplot2 is a common requirement when creating visualizations like heatmaps, treemaps, or waffle charts. Labels provide crucial context, displaying the exact values represented by each tile, which significantly improves the interpretability of your plots. This article will guide you through different techniques to place text labels directly onto your ggplot2 tiles, covering various scenarios and customization options.
Basic Tile Labeling with geom_text()
The most straightforward way to add labels to tiles in ggplot2 is by using geom_text(). This geometry allows you to place text at specific x and y coordinates, which, in the context of tiles, usually means placing the text at the center of each tile. You'll typically map the variable you want to display as the label to the label aesthetic.
library(ggplot2)
library(dplyr)

# Sample data for a heatmap
data_heatmap <- expand.grid(X = 1:5, Y = 1:5) %>%
  mutate(Value = round(runif(25, 0, 100), 0))

# Basic heatmap with labels
ggplot(data_heatmap, aes(x = X, y = Y, fill = Value)) +
  geom_tile(color = "white", linewidth = 0.5) +
  geom_text(aes(label = Value), color = "black", size = 4) +
  scale_fill_gradient(low = "lightblue", high = "darkblue") +
  labs(title = "Heatmap with Tile Labels", x = "X-axis", y = "Y-axis") +
  theme_minimal()
Basic geom_tile plot with geom_text for labeling.

Example of a basic heatmap with numerical labels on each tile.
geom_text(), ensure your color aesthetic for the text provides sufficient contrast against your tile fill colors for readability. You might also need to adjust size based on the number of tiles and plot dimensions.Customizing Label Appearance and Positioning
Beyond basic labeling, geom_text() offers several parameters for customization. You can control the text color, size, font face, and even nudge the labels slightly if they overlap or need fine-tuning. For more complex scenarios, like placing labels at specific corners or handling long text, you might need to adjust the x and y aesthetics or use geom_label().
# Customizing label appearance
ggplot(data_heatmap, aes(x = X, y = Y, fill = Value)) +
  geom_tile(color = "white", linewidth = 0.5) +
  geom_text(aes(label = paste0(Value, "%")),
            color = "white",
            size = 5,
            fontface = "bold",
            nudge_y = 0.1) + # Nudge labels slightly up
  scale_fill_gradient(low = "orange", high = "red") +
  labs(title = "Customized Tile Labels", x = "Category X", y = "Category Y") +
  theme_minimal()
Customizing label color, size, font, and position.
Using geom_label() for Backgrounded Labels
If your tile colors are diverse or you need labels to stand out more, geom_label() is an excellent alternative. It works similarly to geom_text() but draws a rectangular background behind each label, improving readability, especially on busy backgrounds. You can customize the fill color, border, and rounding of these label backgrounds.
# Using geom_label for backgrounded labels
ggplot(data_heatmap, aes(x = X, y = Y, fill = Value)) +
  geom_tile(color = "white", linewidth = 0.5) +
  geom_label(aes(label = Value),
             fill = "white",
             color = "black",
             label.padding = unit(0.2, "lines"),
             label.r = unit(0.15, "lines"), # Rounded corners
             size = 4) +
  scale_fill_gradient(low = "lightgreen", high = "darkgreen") +
  labs(title = "Heatmap with Backgrounded Labels", x = "X", y = "Y") +
  theme_minimal()
Applying geom_label for labels with a background.
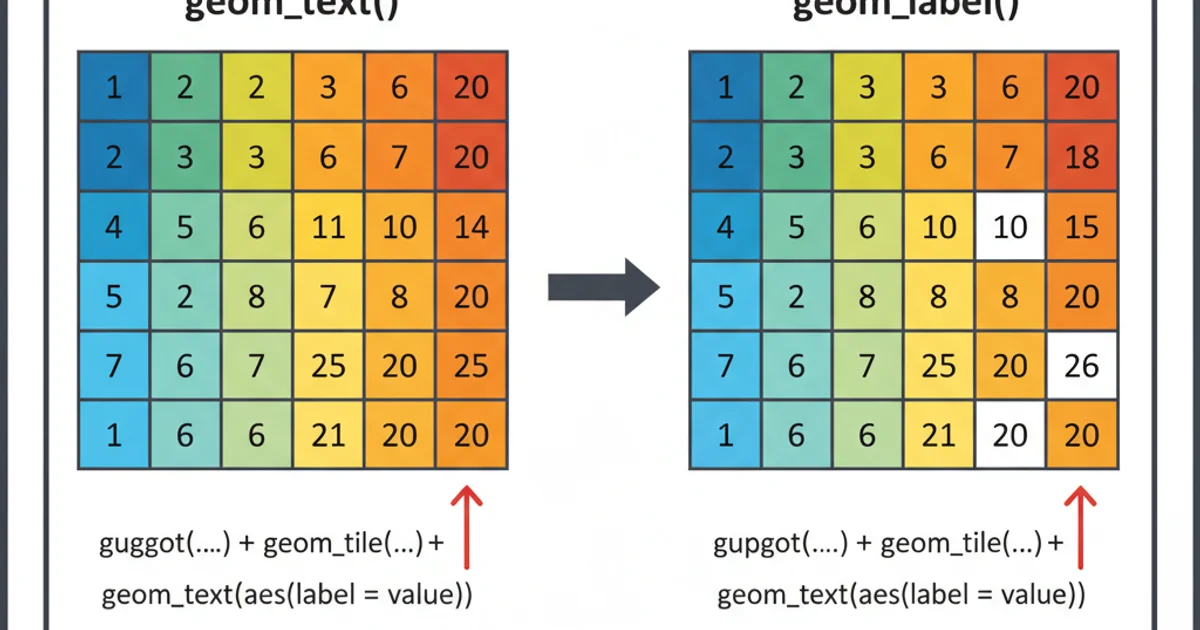
Comparison of geom_text vs. geom_label for tile labeling.
size, nudge_x/nudge_y, or filtering labels for only the most significant values if overlap becomes an issue.Labeling Treemaps with ggraph or treemapify
For treemaps, which are often created using packages like treemapify or ggraph, the labeling approach is similar but integrated into their specific geometries. These packages often provide their own geom_text or geom_label wrappers designed to work seamlessly with their treemap layouts.
library(treemapify)

# Sample data for a treemap
data_treemap <- data.frame(
  group = c("A", "B", "C", "D", "E"),
  value = c(15, 25, 10, 30, 20)
)

# Treemap with labels using treemapify
ggplot(data_treemap, aes(area = value, fill = group, label = paste0(group, "\n", value))) +
  geom_treemap() +
  geom_treemap_text(colour = "white", place = "centre", grow = TRUE) +
  labs(title = "Treemap with Labels") +
  theme(legend.position = "none")
Treemap labeling using geom_treemap_text from treemapify.
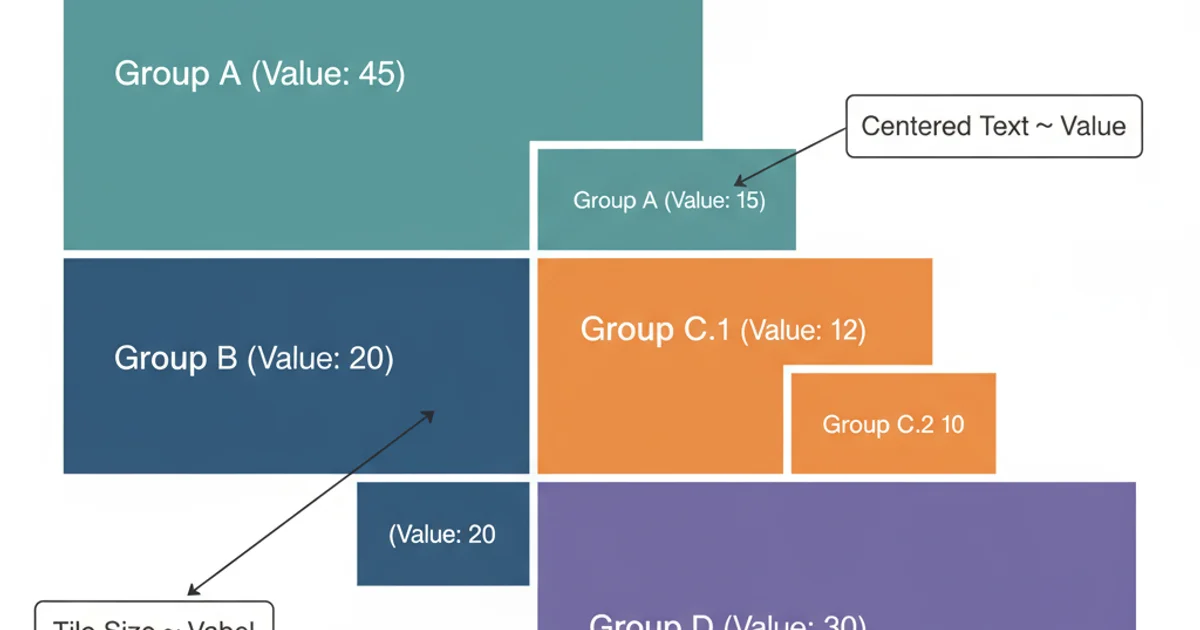
Example of a treemap with labels on each tile.
grow = TRUE in geom_treemap_text() to allow text size to adapt to the tile size, improving readability for larger tiles.