Creating External Monitoring for a web app
Categories:
Creating Robust External Monitoring for Your Web Application
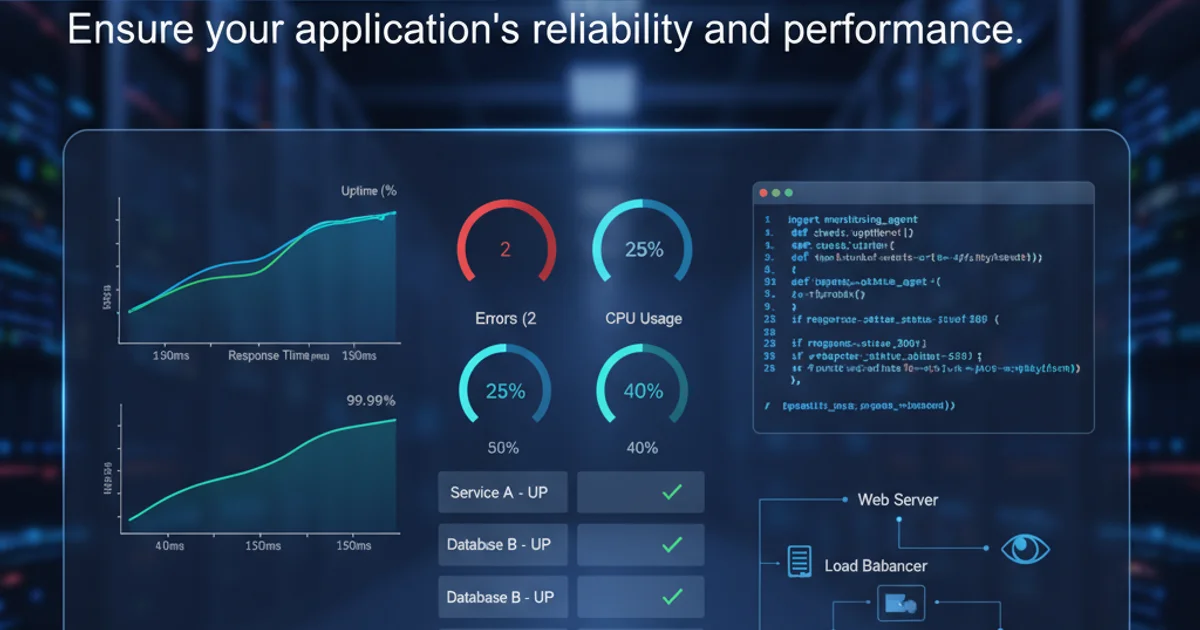
Learn how to implement effective external monitoring for web applications hosted on platforms like Amazon EC2, ensuring high availability and performance.
External monitoring is a critical component of maintaining a healthy and reliable web application. While internal monitoring provides insights into server health and application performance from within your infrastructure, external monitoring simulates user experience by checking your application's availability and responsiveness from outside your network. This article will guide you through setting up external monitoring, focusing on web applications typically hosted on cloud platforms like Amazon EC2.
Why External Monitoring is Essential
Internal monitoring tools, such as those provided by cloud providers (e.g., Amazon CloudWatch), are excellent for tracking CPU utilization, memory usage, disk I/O, and application-level metrics. However, they might not detect issues that prevent users from accessing your application, such as DNS resolution problems, network routing issues, or misconfigured firewalls. External monitoring acts as your 'eyes and ears' from the internet, alerting you to problems before your users do.
flowchart TD
    A[User Browser] --> B(Internet)
    B --> C[External Monitoring Service]
    C --> D[DNS Resolution]
    D --> E[Load Balancer / CDN]
    E --> F[Web Server (e.g., EC2)]
    F --> G[Application Code]
    G --> H[Database]
    C -- Checks --> D
    C -- Checks --> E
    C -- Checks --> F
    C -- Checks --> G
    C -- Alerts if failure --> I[Monitoring Dashboard / Alerts]
External Monitoring Flow for a Web Application
Key Aspects of External Monitoring
When setting up external monitoring, consider the following aspects to ensure comprehensive coverage:
- Uptime Monitoring: Basic checks to ensure your web server responds to HTTP/HTTPS requests. This often involves checking for a 200 OK status code.
- Performance Monitoring: Measuring response times for various pages or API endpoints. Slow response times can be as detrimental as complete outages.
- Content Verification: Ensuring that the expected content is present on the page. This helps detect cases where the server is up but serving incorrect or error pages.
- Transaction Monitoring: Simulating multi-step user journeys (e.g., login, add to cart, checkout) to ensure critical business flows are functional.
- Geographic Distribution: Monitoring from multiple global locations to detect regional issues and understand performance variations for different user bases.
- SSL Certificate Monitoring: Alerts for expiring or invalid SSL certificates, preventing security warnings and service interruptions.
Implementing External Monitoring with Common Tools
Several services offer external monitoring capabilities. Popular choices include UptimeRobot, Pingdom, New Relic Synthetics, Datadog Synthetics, and AWS Route 53 health checks. While each has its nuances, the core principles remain similar. Here, we'll outline a general approach and provide an example using a simple HTTP check.
1. Choose a Monitoring Service
Select an external monitoring provider that fits your budget and requirements. Consider features like global locations, alert channels (email, SMS, Slack), transaction monitoring, and reporting capabilities.
2. Define Your Monitoring Targets
Identify the URLs or API endpoints you want to monitor. This should include your main website, critical API endpoints, and potentially static assets if their availability is crucial.
3. Configure Basic Uptime Checks
Set up HTTP/HTTPS checks for your primary domain. Most services allow you to specify the expected HTTP status code (e.g., 200 OK) and a timeout period. You can also often specify a string to look for on the page to confirm content delivery.
4. Add Performance and Content Checks
Beyond basic uptime, configure checks that measure response times and verify specific content. For example, ensure your homepage loads within 2 seconds and contains the text 'Welcome to our service'.
5. Set Up Alerting
Crucially, configure alert notifications. This typically involves email, SMS, or integration with communication platforms like Slack or PagerDuty. Define who should be alerted and under what conditions (e.g., after 2 consecutive failures from different locations).
6. Implement Transaction Monitoring (Optional but Recommended)
For critical user flows, use transaction monitoring to simulate user interactions. This might involve scripting a sequence of actions like logging in, navigating to a product page, and adding an item to a cart. This ensures the entire user journey is functional.
# Example: Simple HTTP check using curl (for manual testing or basic scripting)
# This simulates what an external monitor might do.

# Check for HTTP 200 OK status
STATUS_CODE=$(curl -s -o /dev/null -w '%{http_code}' https://your-webapp.com)

if [ "$STATUS_CODE" -eq 200 ]; then
  echo "Web app is up and responding with 200 OK."
else
  echo "Web app is down or responding with status: $STATUS_CODE."
fi

# Check for specific content on the page
if curl -s https://your-webapp.com | grep -q "Welcome to our service"; then
  echo "Expected content found on the page."
else
  echo "Expected content NOT found on the page."
fi
Manual HTTP and content check using curl