Is it possible to "decompile" a Windows .exe? Or at least view the Assembly?
Categories:
Decompiling Windows .exe Files: Understanding the Possibilities and Limitations

Explore the feasibility of decompiling Windows .exe files, the tools available for viewing assembly code, and the challenges involved in reverse engineering compiled binaries.
When working with Windows applications, especially in debugging, security analysis, or interoperability scenarios, the question often arises: can you 'decompile' a .exe file back into its original source code? While a direct, perfect reconstruction of high-level source code is generally not possible, there are powerful tools and techniques to analyze compiled binaries. This article delves into what's achievable, focusing on viewing assembly code and the concept of decompilation for different programming languages.
The Nature of Compilation: Why Perfect Decompilation is Hard
When source code (like C++, C#, or Python) is compiled into a Windows .exe file, it undergoes several transformations. High-level constructs (variables, loops, functions) are translated into machine-specific instructions (assembly code). During this process, much of the semantic information present in the original source code, such as variable names, comments, and complex data structures, is often lost or optimized away. The compiler's primary goal is to produce efficient machine code, not easily reversible source code.
flowchart TD
    A[High-Level Source Code] --> B{Compiler}
    B --> C[Intermediate Representation (IR)]
    C --> D{Optimizer}
    D --> E[Assembly Code]
    E --> F[Machine Code (Executable .exe)]
    F --x G[Original Source Code (Direct Decompilation)]
    F --> H[Disassembler]
    H --> I[Assembly View]
    F --> J[Decompiler (Managed Code)]
    J --> K[Pseudo-Code (Managed Code)]
Compilation and Reverse Engineering Process Flow
Viewing Assembly Code: Disassemblers
The most direct way to understand what a compiled .exe is doing is to view its assembly code. A disassembler takes machine code and translates it back into human-readable assembly language instructions. This process is always possible because assembly is a direct, one-to-one mapping of machine instructions. However, understanding complex programs purely from assembly can be extremely challenging due to the low-level nature of the code and the sheer volume of instructions.
section .text
    global _start

_start:
    ; Exit program
    mov eax, 1      ; System call number for exit (sys_exit)
    xor ebx, ebx    ; Exit code 0
    int 0x80        ; Call kernel
Example of simple x86 assembly code
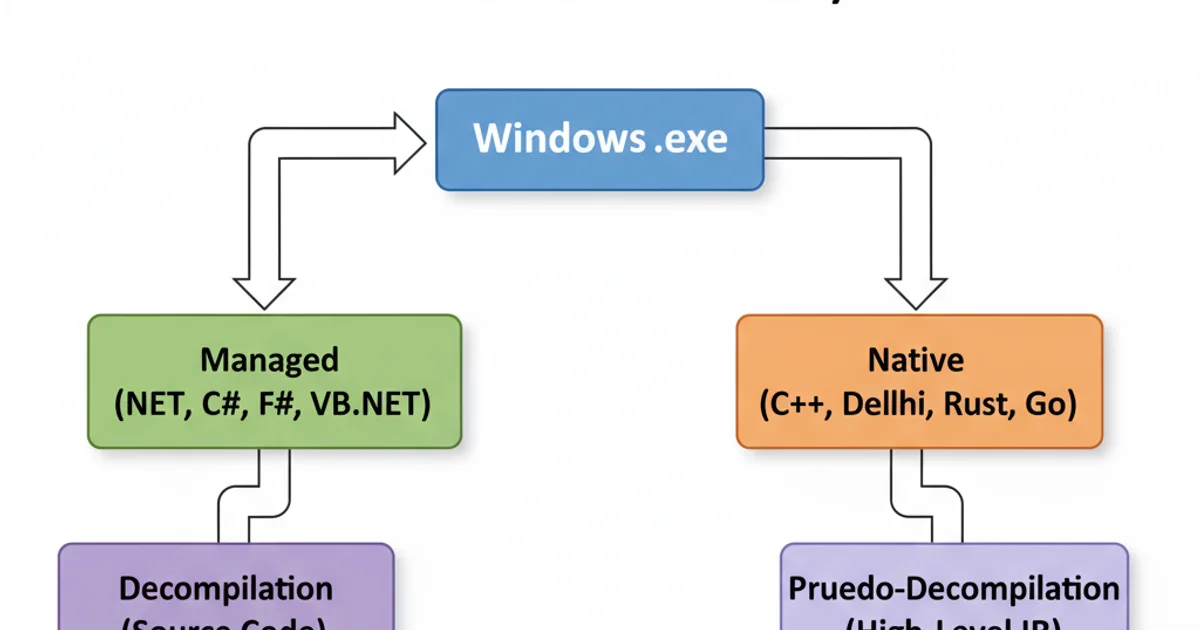
Decompilation: Native vs. Managed Code
The term 'decompilation' has different implications depending on whether the .exe is compiled from native code (like C/C++) or managed code (like C#/.NET or Java).
Native Code Decompilation
For native executables, decompilers attempt to reconstruct higher-level code from assembly. This is a much harder problem than simple disassembly. Tools like IDA Pro and Ghidra use sophisticated algorithms to identify function boundaries, data types, control flow structures (loops, conditionals), and even attempt to infer variable names. The output is typically a C-like pseudo-code, which, while not identical to the original source, is significantly more readable than raw assembly.
Managed Code Decompilation
Managed code, such as .NET assemblies (which also often have a .exe extension), is compiled into an Intermediate Language (IL) rather than directly into machine code. This IL is then executed by a runtime environment (like the .NET Common Language Runtime). Because IL retains much more high-level information than native machine code, decompiling managed executables back to a very close approximation of the original source code (e.g., C#) is highly effective and common. Tools like dotPeek, ILSpy, and dnSpy excel at this.
Popular Tools for Disassembly and Decompilation
Several powerful tools are available for analyzing Windows executables:
- IDA Pro: A highly advanced and widely used disassembler and decompiler, especially for native code. It offers extensive features for static and dynamic analysis, supporting various architectures.
- Ghidra: Developed by the NSA, Ghidra is a free and open-source reverse engineering framework. It provides powerful disassembly, decompilation (to C-like pseudo-code), and scripting capabilities, making it a strong competitor to IDA Pro.
- x64dbg/x32dbg: A free and open-source debugger for Windows, offering excellent assembly-level debugging capabilities, including viewing registers, memory, and stepping through code.
- OllyDbg: Another popular free debugger for Windows, focusing on binary code analysis.
- dotPeek, ILSpy, dnSpy: These are excellent free decompilers specifically for .NET assemblies, capable of reconstructing C#, VB.NET, and F# code from IL.
Choosing the Right Tool for Binary Analysis
In conclusion, while 'decompiling' a native Windows .exe to its original, perfectly readable source code is generally not possible, viewing its assembly code is always an option with disassemblers. For managed executables, highly accurate decompilation back to a high-level language is very much achievable. The choice of tool depends on the type of executable and the depth of analysis required.