Why Android Studio says "Waiting For Debugger" if am NOT debugging?
Categories:
Understanding 'Waiting For Debugger' in Android Studio (Even When Not Debugging)

Explore the common reasons behind the 'Waiting For Debugger' message in Android Studio, even when you haven't explicitly started a debug session, and learn how to resolve them.
You've just hit 'Run' on your Android Studio project, expecting your app to launch quickly on your device or emulator. Instead, you're greeted with the persistent 'Waiting For Debugger' message, and your app never starts. This can be a frustrating experience, especially when you're certain you haven't initiated a debug session. This article delves into the common culprits behind this seemingly paradoxical behavior and provides practical solutions to get your development workflow back on track.
The Nature of Android Debugging and ADB
Before diving into solutions, it's crucial to understand how Android's debugging mechanism works. Android applications run within a Dalvik/ART virtual machine. When debugging, a debugger client (like Android Studio) connects to a debug server (ADB, Android Debug Bridge) which then communicates with the debuggable process on the device. This connection allows the debugger to inspect variables, set breakpoints, and control execution flow.
The 'Waiting For Debugger' message indicates that the application process on the device has started but is paused, expecting a debugger to attach to it. This pause is intentional to allow the debugger to connect before any significant code execution occurs. The key is to figure out why your app is entering this paused state when you don't want it to.
sequenceDiagram
    participant AS as Android Studio
    participant ADB as Android Debug Bridge
    participant Device as Android Device/Emulator
    participant App as Your Android App Process

    AS->>ADB: Run/Debug App Command
    ADB->>Device: Install & Launch App
    Device->>App: Start Process (Debuggable)
    App-->>Device: Process Paused (Waiting for Debugger)
    Device-->>ADB: App Waiting for Debugger
    ADB-->>AS: 'Waiting For Debugger' Message
    alt Debug Session
        AS->>ADB: Attach Debugger
        ADB->>Device: Connect Debugger
        Device->>App: Resume Process
    else Non-Debug Session (Problematic)
        App->>App: Remains Paused
    end
Sequence diagram illustrating the 'Waiting For Debugger' state
Common Causes and Solutions
Several factors can lead to your app waiting for a debugger even when you're not explicitly debugging. Identifying the root cause is the first step towards a resolution.
File > Invalidate Caches / Restart...) as a first troubleshooting step. This often resolves transient issues.1. Debuggable Flag in AndroidManifest.xml
The most common reason is that your application's AndroidManifest.xml or build.gradle file explicitly sets the android:debuggable attribute to true for release builds, or a build variant is configured to be debuggable by default.
While android:debuggable="true" is automatically added by Android Studio for debug builds, it should generally be false for release builds. If it's explicitly set to true in your manifest, it forces the app to be debuggable regardless of the build type.
<!-- Incorrect: Forces debuggable in release -->
<application
    android:allowBackup="true"
    android:icon="@mipmap/ic_launcher"
    android:label="@string/app_name"
    android:debuggable="true" <!-- This is the culprit! -->
    android:roundIcon="@mipmap/ic_launcher_round"
    android:supportsRtl="true"
    android:theme="@style/AppTheme">
    <!-- ... activities ... -->
</application>
Example of an incorrectly set android:debuggable flag in AndroidManifest.xml
Solution:
Check
AndroidManifest.xml: Open yourAndroidManifest.xmlfile and ensure thatandroid:debuggable="true"is not explicitly present within the<application>tag. If it is, remove it.Check
build.gradle(Module: app): Thedebuggableproperty is usually controlled by yourbuild.gradlefile. Ensure yourreleasebuild type does not havedebuggable trueset.android { buildTypes { release { minifyEnabled false proguardFiles getDefaultProguardFile('proguard-android-optimize.txt'), 'proguard-rules.pro' debuggable false // Ensure this is false for release builds } debug { debuggable true // This is usually true by default for debug builds } } }If you're running a
releasebuild and it's still waiting, this is the most likely place to check.
2. Persistent Debugger Connection Issues
Sometimes, a previous debug session might not have terminated cleanly, leaving ADB in a confused state, or a debugger might still be 'attached' logically even if Android Studio isn't actively debugging. This can happen if Android Studio crashed or was force-closed during a debug session.
Solution:
Restart ADB: Open your terminal or command prompt and navigate to your Android SDK platform-tools directory (e.g.,
C:\Users\YourUser\AppData\Local\Android\Sdk\platform-toolson Windows, or/Users/YourUser/Library/Android/sdk/platform-toolson macOS).Execute the following commands:
adb kill-server
adb start-server
This will restart the ADB daemon, often resolving lingering connection issues.
Restart Android Studio: A full restart of Android Studio can clear internal states and re-initialize connections.
Reboot Device/Emulator: Sometimes the issue lies with the device itself. A simple reboot can clear any stuck processes or debugger flags.
3. 'Wait for Debugger' Option in Developer Settings
Android devices have a developer option called 'Wait for debugger' (or similar, like 'Select debug app' and 'Wait for debugger'). If this option is enabled for your application, the system will intentionally pause your app's launch until a debugger attaches, regardless of whether you initiated a debug session from Android Studio.
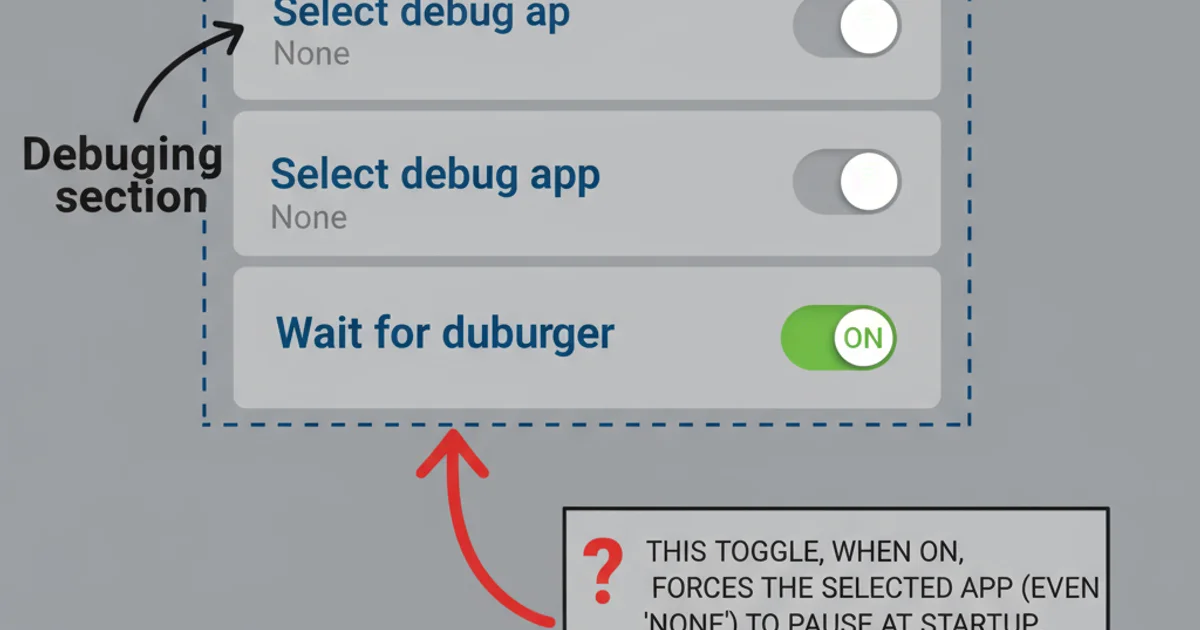
Locating 'Select debug app' and 'Wait for debugger' in Android Developer Options.
Solution:
Disable 'Wait for debugger':
- Go to your Android device's
Settings. - Scroll down and tap
Developer options(if you don't see it, go toAbout phoneand tapBuild numberseven times). - Look for
Select debug appand ensure it's set to(None)or your app is not selected. - Find the
Wait for debuggertoggle and ensure it is OFF.
This is a common trap, especially if you've been experimenting with debugging specific apps.
- Go to your Android device's
4. Instant Run / Apply Changes Issues (Older Android Studio Versions)
In older versions of Android Studio, features like 'Instant Run' (now 'Apply Changes' or 'Apply Code Changes') could sometimes interfere with the build and deployment process, leading to unexpected debugger waits. While much improved, occasional glitches can still occur.
Solution:
Disable 'Apply Changes': Temporarily disable 'Apply Changes' in Android Studio settings:
- Go to
File > Settings(Windows/Linux) orAndroid Studio > Preferences(macOS). - Navigate to
Build, Execution, Deployment > Deployment. - Uncheck the options related to 'Apply Changes' or 'Instant Run' if present. For newer versions, you might find options under
Build, Execution, Deployment > Debugger > Hot SwaporBuild, Execution, Deployment > Instant Run(if using an older AS version).
- Go to
Perform a Clean Build: After disabling, perform a
Build > Clean Projectfollowed byBuild > Rebuild Project.
5. Corrupted Build Files or Cache
Sometimes, Android Studio's internal caches or generated build files can become corrupted, leading to erratic behavior, including false 'Waiting For Debugger' states.
Solution:
Invalidate Caches / Restart: This is a powerful option that often resolves many obscure Android Studio issues.
- Go to
File > Invalidate Caches / Restart.... - Select
Invalidate and Restart.
- Go to
Delete
.gradleand.ideafolders: Close Android Studio, then manually delete the.gradlefolder and the.ideafolder from your project's root directory. Also, delete thebuildfolder within your app module. Then reopen Android Studio and let it re-sync the project.
.gradle and .idea folders will reset some project-specific settings and force a full re-indexing and Gradle sync. Ensure Android Studio is closed before doing this.Conclusion
The 'Waiting For Debugger' message, when you're not debugging, is a common annoyance that can significantly slow down development. By systematically checking the android:debuggable flag, restarting ADB, verifying device developer options, and clearing caches, you can almost always pinpoint and resolve the underlying issue. Understanding the debugging lifecycle helps demystify these occurrences and empowers you to troubleshoot more effectively.