Creating a Pandas DataFrame from a Numpy array: How do I specify the index column and column head...
Categories:
Creating a Pandas DataFrame from a NumPy Array with Custom Index and Columns
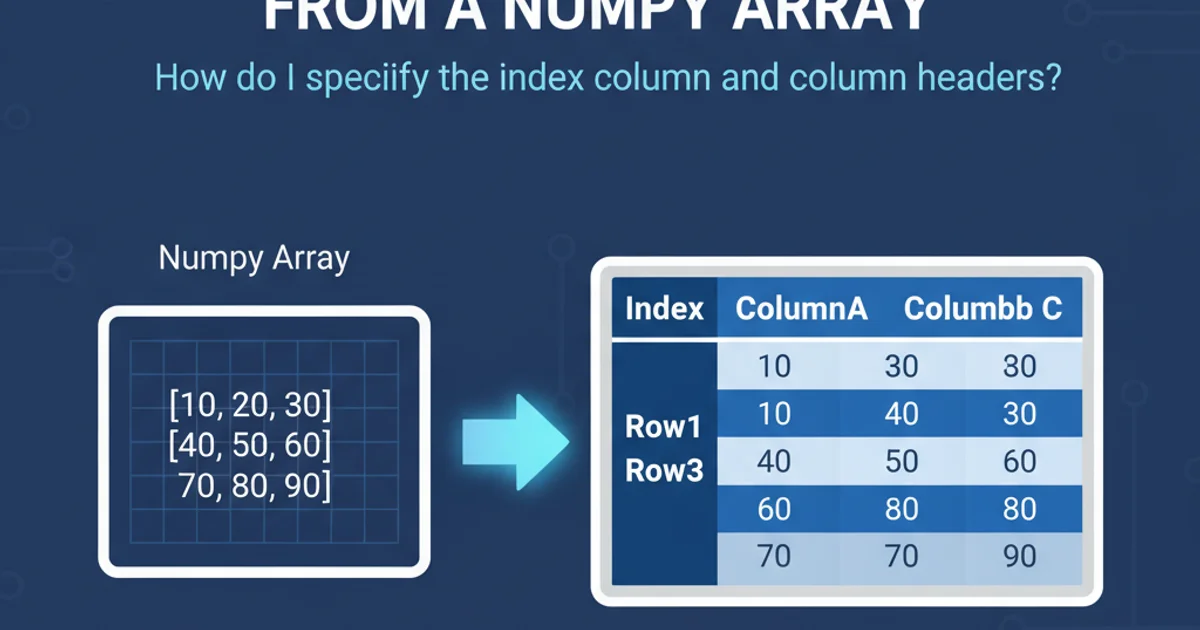
Learn how to convert NumPy arrays into Pandas DataFrames, specifying custom row indices and column headers for better data organization and analysis.
Pandas DataFrames are a fundamental data structure for data manipulation and analysis in Python, offering powerful features like labeled axes (rows and columns). Often, your raw data might originate from NumPy arrays, which are efficient for numerical operations but lack the inherent labeling capabilities of DataFrames. This article will guide you through the process of converting a NumPy array into a Pandas DataFrame, focusing on how to explicitly define both the index (row labels) and column headers.
Basic Conversion: NumPy Array to DataFrame
The simplest way to create a DataFrame from a NumPy array is to pass the array directly to the pd.DataFrame() constructor. By default, Pandas will assign a default integer index (0, 1, 2, ...) and default integer column headers (0, 1, 2, ...). This is useful for quick conversions but often insufficient for real-world data analysis where meaningful labels are crucial.
import pandas as pd
import numpy as np

# Create a sample NumPy array
data_array = np.array([
    [10, 20, 30],
    [40, 50, 60],
    [70, 80, 90]
])

# Convert to DataFrame without specifying index or columns
df_basic = pd.DataFrame(data_array)
print("Basic DataFrame:\n", df_basic)
Converting a NumPy array to a DataFrame with default index and columns.
Specifying Column Headers
To make your DataFrame more readable and easier to work with, you'll want to assign descriptive names to your columns. This can be done using the columns parameter in the pd.DataFrame() constructor. The columns parameter expects a list of strings, where each string corresponds to a column in your NumPy array, in order from left to right.
import pandas as pd
import numpy as np

data_array = np.array([
    [10, 20, 30],
    [40, 50, 60],
    [70, 80, 90]
])

# Define custom column names
column_names = ['Feature_A', 'Feature_B', 'Feature_C']

# Convert to DataFrame with custom column names
df_columns = pd.DataFrame(data_array, columns=column_names)
print("DataFrame with Custom Columns:\n", df_columns)
Creating a DataFrame with specified column headers.
Specifying the Index Column (Row Labels)
Just as column headers provide labels for vertical data, the index provides labels for horizontal data (rows). A meaningful index can represent timestamps, unique identifiers, or categories, making data retrieval and alignment much more intuitive. You can specify the index using the index parameter in the pd.DataFrame() constructor. This parameter also expects a list of labels, corresponding to each row in your NumPy array.
import pandas as pd
import numpy as np

data_array = np.array([
    [10, 20, 30],
    [40, 50, 60],
    [70, 80, 90]
])

# Define custom row labels (index)
row_labels = ['Row_1', 'Row_2', 'Row_3']

# Convert to DataFrame with custom index
df_index = pd.DataFrame(data_array, index=row_labels)
print("DataFrame with Custom Index:\n", df_index)
Creating a DataFrame with specified row labels (index).
Combining Custom Index and Column Headers
For maximum clarity and utility, you'll often want to specify both the index and the column headers simultaneously. This is achieved by passing both the index and columns parameters to the pd.DataFrame() constructor. Ensure that the length of your index list matches the number of rows in your NumPy array, and the length of your columns list matches the number of columns.
import pandas as pd
import numpy as np

data_array = np.array([
    [10, 20, 30],
    [40, 50, 60],
    [70, 80, 90]
])

# Define custom row labels and column names
row_labels = ['Jan', 'Feb', 'Mar']
column_names = ['Sales', 'Expenses', 'Profit']

# Convert to DataFrame with both custom index and columns
df_full = pd.DataFrame(data_array, index=row_labels, columns=column_names)
print("DataFrame with Custom Index and Columns:\n", df_full)
Creating a DataFrame with both custom index and column headers.
flowchart TD
    A[NumPy Array] --> B{"pd.DataFrame()"}
    B --> C{Specify 'index' parameter?}
    C -- Yes --> D[Custom Row Labels]
    C -- No --> E[Default Integer Index]
    B --> F{Specify 'columns' parameter?}
    F -- Yes --> G[Custom Column Headers]
    F -- No --> H[Default Integer Columns]
    D & G --> I[Fully Labeled DataFrame]
    D & H --> J[DataFrame with Custom Index, Default Columns]
    E & G --> K[DataFrame with Default Index, Custom Columns]
    E & H --> L[DataFrame with Default Index & Columns]
Decision flow for creating a Pandas DataFrame from a NumPy array with custom labels.
pd.to_datetime() to create a DatetimeIndex for your DataFrame. This provides powerful time-based indexing and slicing capabilities.Handling Mismatched Dimensions
It's crucial that the length of your index list matches the number of rows in your NumPy array, and the length of your columns list matches the number of columns. If there's a mismatch, Pandas will raise a ValueError. Always verify the dimensions of your array and the lengths of your label lists before conversion.
import pandas as pd
import numpy as np

data_array = np.array([
    [10, 20],
    [30, 40]
])

try:
    # Mismatched column names (3 names for 2 columns)
    df_error = pd.DataFrame(data_array, columns=['Col_A', 'Col_B', 'Col_C'])
except ValueError as e:
    print(f"Error: {e}")

try:
    # Mismatched index (3 labels for 2 rows)
    df_error_index = pd.DataFrame(data_array, index=['R1', 'R2', 'R3'])
except ValueError as e:
    print(f"Error: {e}")
Example of ValueError due to mismatched dimensions.
pd.DataFrame() constructor is highly flexible. You can also create DataFrames from dictionaries, lists of dictionaries, or even other DataFrames. Understanding its parameters is key to efficient data handling.