VS2008: Unable to start debugging, Remote Debugging Monitor has been closed
Categories:
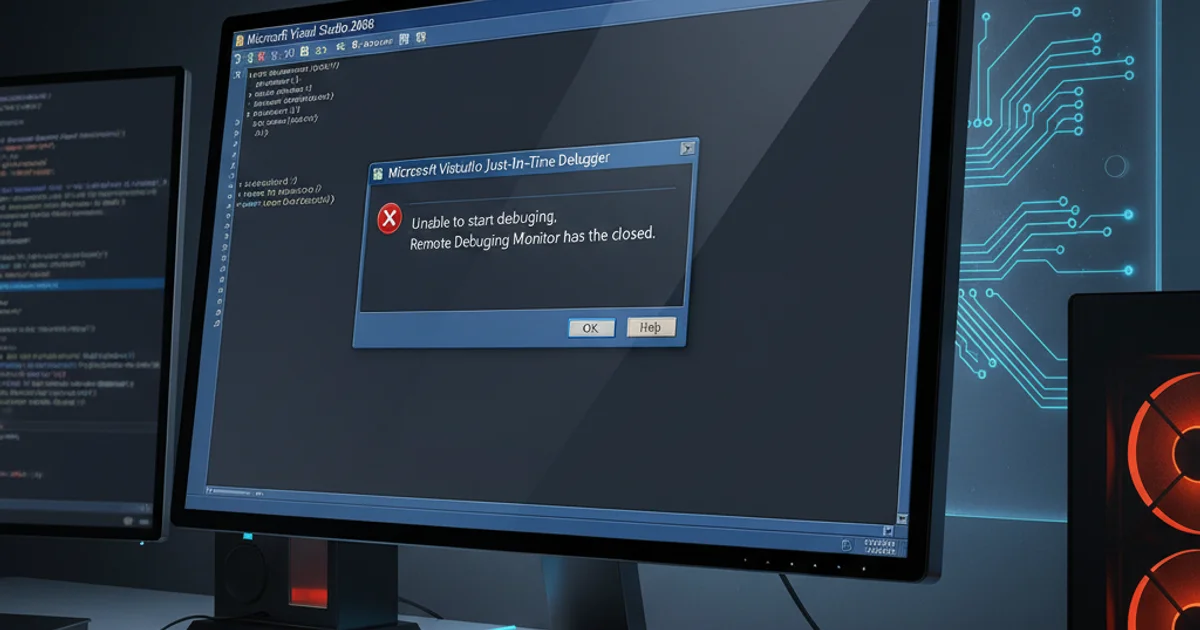
VS2008 Debugging Error: 'Unable to start debugging, Remote Debugging Monitor has been closed'
Troubleshoot and resolve the common Visual Studio 2008 debugging error 'Unable to start debugging, Remote Debugging Monitor has been closed', particularly in 64-bit environments.
Encountering the error message "Unable to start debugging, Remote Debugging Monitor has been closed" in Visual Studio 2008 can be a frustrating experience, especially when working on a 64-bit operating system. This issue often arises due to conflicts or misconfigurations related to how Visual Studio's debugging components interact with the underlying system architecture, particularly the WOW64 subsystem. This article will guide you through understanding the root causes and provide practical solutions to get your debugger up and running again.
Understanding the 'Remote Debugging Monitor' Error
Visual Studio 2008, being a 32-bit application, relies on the Windows On Windows 64-bit (WOW64) compatibility layer when running on a 64-bit operating system. The 'Remote Debugging Monitor' (msvsmon.exe) is a critical component that facilitates the debugging process, even for local debugging sessions. When this error occurs, it typically means that msvsmon.exe failed to start, crashed unexpectedly, or was unable to establish a connection with the Visual Studio IDE. This can be due to several factors, including incorrect permissions, firewall restrictions, corrupted debugger components, or conflicts with other running processes.
flowchart TD
    A[Start Debugging in VS2008] --> B{Is OS 64-bit?}
    B -->|Yes| C[VS2008 (32-bit) uses WOW64]
    B -->|No| D[VS2008 (32-bit) runs natively]
    C --> E[VS tries to launch msvsmon.exe]
    D --> E
    E --> F{msvsmon.exe starts successfully?}
    F -->|Yes| G[Debugging Session Established]
    F -->|No| H["Error: Remote Debugging Monitor has been closed"]
    H --> I[Troubleshoot: Permissions, Firewall, WOW64, Corrupt Files]
Flowchart of VS2008 Debugging Process and Error Point
Common Causes and Solutions
The 'Remote Debugging Monitor' error often points to environmental issues rather than code problems. Addressing these system-level factors is key to resolving the issue. We'll explore the most common culprits and their respective fixes.
1. Run Visual Studio as Administrator
On Windows Vista, 7, or later, User Account Control (UAC) can prevent Visual Studio from launching necessary processes with sufficient permissions. Right-click the Visual Studio 2008 shortcut and select 'Run as administrator'. This often resolves permission-related issues for the debugger.
2. Check Firewall Settings
Windows Firewall or third-party security software can block msvsmon.exe from communicating. Ensure that msvsmon.exe (located in C:\Program Files (x86)\Microsoft Visual Studio 9.0\Common7\IDE\Remote Debugger\x86 or x64 depending on the target) is allowed through your firewall. You might need to add an exception for both the x86 and x64 versions if you're debugging mixed-mode applications.
3. Manually Start the Remote Debugging Monitor
Navigate to C:\Program Files (x86)\Microsoft Visual Studio 9.0\Common7\IDE\Remote Debugger\x86 (for 32-bit applications) or x64 (for 64-bit applications) and manually run msvsmon.exe. Observe if it starts successfully or if it reports any errors. If it starts, try debugging from Visual Studio again. If it fails, the error message from msvsmon.exe itself might provide more clues.
4. Repair Visual Studio Installation
Corrupted installation files can lead to debugger failures. Go to 'Control Panel' -> 'Programs and Features', find 'Microsoft Visual Studio 2008', and choose the 'Change/Remove' option. From there, select 'Repair' to fix any damaged components. This can often resolve issues with missing or corrupted debugger files.
5. Verify WOW64 Configuration (Advanced)
While less common, issues with the WOW64 subsystem itself can sometimes interfere. Ensure your Windows installation is up-to-date. For specific scenarios, you might need to investigate system event logs for WOW64-related errors. This is usually a last resort after trying other solutions.
:: Navigate to the x86 debugger directory
cd "C:\Program Files (x86)\Microsoft Visual Studio 9.0\Common7\IDE\Remote Debugger\x86"

:: Start the 32-bit remote debugging monitor
msvsmon.exe /noauth /nosecurity /anyuser

:: For 64-bit applications, use the x64 directory
cd "C:\Program Files (x86)\Microsoft Visual Studio 9.0\Common7\IDE\Remote Debugger\x64"
msvsmon.exe /noauth /nosecurity /anyuser
Manually launching msvsmon.exe from the command line with common options.
/noauth or /nosecurity with msvsmon.exe should only be done in secure development environments and for troubleshooting purposes. It disables security checks and could expose your debugging session to unauthorized access if used on a network.