Frequency spectrum of a square wave in MATLAB
Categories:
Unveiling the Harmonics: Frequency Spectrum of a Square Wave in MATLAB

Explore how to analyze the frequency components of a square wave using MATLAB's Fast Fourier Transform (FFT), revealing its fundamental and harmonic frequencies.
Understanding the frequency content of a signal is fundamental in many engineering and scientific disciplines. A square wave, despite its simple appearance in the time domain, possesses a rich and complex frequency spectrum. This article will guide you through the process of generating a square wave in MATLAB and then using the Fast Fourier Transform (FFT) to visualize its frequency components, specifically highlighting its odd harmonics.
Generating a Square Wave in MATLAB
Before we can analyze the frequency spectrum, we first need to create a square wave signal. MATLAB provides the square function, which is ideal for this purpose. We'll define parameters such as frequency, amplitude, and duty cycle, and then generate a time-domain representation of the wave.
% Define signal parameters
Fs = 1000;          % Sampling frequency (Hz)
T = 1/Fs;           % Sampling period
L = 1000;           % Length of signal
t = (0:L-1)*T;      % Time vector

F0 = 50;            % Fundamental frequency of the square wave (Hz)
A = 1;              % Amplitude
DutyCycle = 50;     % Duty cycle in percent (50% for a perfect square wave)

% Generate the square wave
x = A * square(2*pi*F0*t, DutyCycle);

% Plot the time-domain signal
figure;
plot(t, x);
title('Square Wave in Time Domain');
xlabel('Time (s)');
ylabel('Amplitude');
grid on;
MATLAB code to generate and plot a 50 Hz square wave.
Understanding the Fast Fourier Transform (FFT)
The Fast Fourier Transform (FFT) is an efficient algorithm to compute the Discrete Fourier Transform (DFT). The DFT converts a signal from its original domain (often time or space) to a representation in the frequency domain. For a square wave, the FFT will reveal that its spectrum consists of a fundamental frequency and an infinite series of odd harmonics, with amplitudes inversely proportional to their harmonic number.
flowchart TD
    A[Time Domain Signal] --> B{"Apply FFT"}
    B --> C[Frequency Domain Spectrum]
    C --> D{"Identify Fundamental Frequency"}
    C --> E{"Identify Harmonic Frequencies"}
    D --> F[Analyze Amplitude & Phase]
    E --> F
Conceptual flow of analyzing a signal's frequency spectrum using FFT.
Computing and Plotting the Frequency Spectrum
Now, we'll apply the FFT to our generated square wave. The output of the FFT will be a complex array, where each element represents the magnitude and phase of a specific frequency component. We'll focus on the magnitude spectrum, which shows the strength of each frequency component. Remember to normalize the FFT output and correctly scale the frequency axis.
% Compute the FFT
Y = fft(x);

% Compute the two-sided spectrum P2
P2 = abs(Y/L);

% Compute the single-sided spectrum P1
P1 = P2(1:L/2+1);
P1(2:end-1) = 2*P1(2:end-1);

% Define the frequency vector
f = Fs*(0:(L/2))/L;

% Plot the single-sided amplitude spectrum
figure;
plot(f, P1);
title('Single-Sided Amplitude Spectrum of Square Wave');
xlabel('Frequency (Hz)');
ylabel('|P1(f)|');
xlim([0 10*F0]); % Limit x-axis to show relevant harmonics
grid on;
MATLAB code to compute and plot the single-sided amplitude spectrum of the square wave.
Interpreting the Results
Upon plotting the frequency spectrum, you should observe distinct peaks at the fundamental frequency (F0) and its odd multiples (3F0, 5F0, 7*F0, etc.). The amplitudes of these harmonics will decrease as the harmonic number increases, following a 1/n relationship (where n is the harmonic number). This characteristic spectrum is a hallmark of square waves and other non-sinusoidal periodic signals.
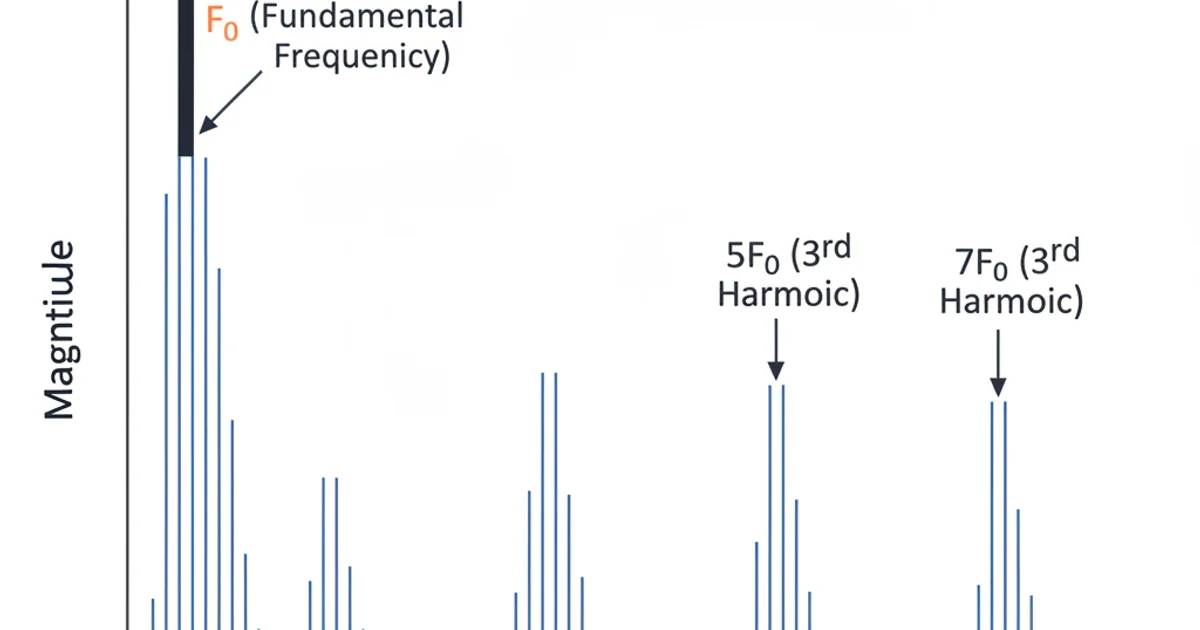
Example frequency spectrum of a square wave, highlighting the fundamental and odd harmonics.