While debugging javascript, is there a way to alert current call stack?
Categories:
Debugging JavaScript: Alerting the Current Call Stack
Explore various methods to inspect and alert the JavaScript call stack during debugging, enhancing your ability to trace execution flow and pinpoint issues.
When debugging complex JavaScript applications, understanding the execution flow is crucial. The call stack provides a snapshot of all active function calls at a particular point in time. While browser developer tools offer robust ways to inspect the call stack, there are scenarios where you might want to programmatically access or 'alert' this information. This article delves into different techniques to achieve this, from simple console logging to more advanced methods, helping you gain deeper insights into your code's behavior.
Understanding the JavaScript Call Stack
The call stack is a mechanism for an interpreter (like the JavaScript interpreter in a web browser or Node.js) to keep track of its place in a script that calls multiple functions. When a script calls a function, the interpreter adds it to the call stack and starts executing it. If that function calls another function, that new function is added to the top of the call stack, and so on. When a function finishes executing, the interpreter removes it from the stack and resumes execution at the last point it left off in the previous function. This LIFO (Last-In, First-Out) structure is fundamental to how JavaScript manages function execution.
sequenceDiagram
    participant Global as Global Execution Context
    participant FuncA as Function A
    participant FuncB as Function B
    participant FuncC as Function C

    Global->>FuncA: Calls FuncA()
    activate FuncA
    FuncA->>FuncB: Calls FuncB()
    activate FuncB
    FuncB->>FuncC: Calls FuncC()
    activate FuncC
    FuncC-->>FuncB: Returns
    deactivate FuncC
    FuncB-->>FuncA: Returns
    deactivate FuncB
    FuncA-->>Global: Returns
    deactivate FuncA
A sequence diagram illustrating how functions are added to and removed from the call stack during execution.
Method 1: Using console.trace()
The simplest and often most effective way to get a call stack trace in JavaScript is by using console.trace(). This method outputs a stack trace to the console, showing you the path of function calls that led to the point where console.trace() was invoked. It's incredibly useful for quick debugging and understanding the flow without pausing execution.
function funcC() {
  console.trace('Trace from funcC');
}

function funcB() {
  funcC();
}

function funcA() {
  funcB();
}

funcA();
Example of using console.trace() to output the call stack.
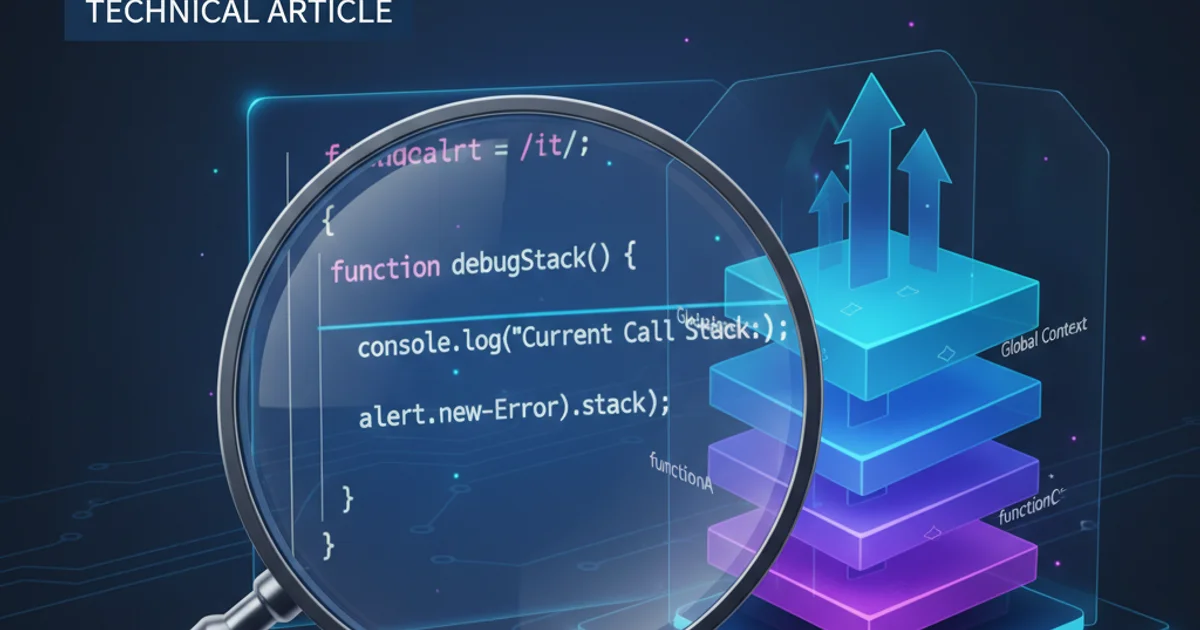
console.trace() is excellent for console output, it doesn't directly provide a string that you can alert(). For that, you'll need to capture the stack trace as a string, as shown in the next method.Method 2: Capturing Stack Trace from an Error Object
A more programmatic way to get the call stack as a string is to create a new Error object. When an Error object is created, it automatically captures the current stack trace in its stack property. This string can then be used in an alert() dialog or processed further.
function funcC() {
  try {
    throw new Error('My custom error for stack trace');
  } catch (e) {
    alert(e.stack);
  }
}

function funcB() {
  funcC();
}

function funcA() {
  funcB();
}

funcA();
Capturing and alerting the call stack using an Error object.
alert() for debugging can be intrusive, especially in a browser environment, as it pauses script execution and requires user interaction. For non-blocking inspection, console.log() or console.trace() are generally preferred.Method 3: Using debugger Keyword and Browser DevTools
While not directly 'alerting' the stack, the debugger keyword is an indispensable tool for interactive debugging. When encountered, it pauses execution and opens the browser's developer tools (if they are open). From there, you can inspect the call stack in detail, set breakpoints, and step through your code. This provides the most comprehensive view of the call stack and execution context.
function funcC() {
  debugger; // Execution will pause here if DevTools are open
  console.log('After debugger in funcC');
}

function funcB() {
  funcC();
}

function funcA() {
  funcB();
}

funcA();
Using the debugger keyword to pause execution and inspect the call stack.
debugger keyword is ignored if developer tools are not open, so it won't affect production code unless explicitly left in and tools are active.