CUDA runtime error (59) : device-side assert triggered
Categories:
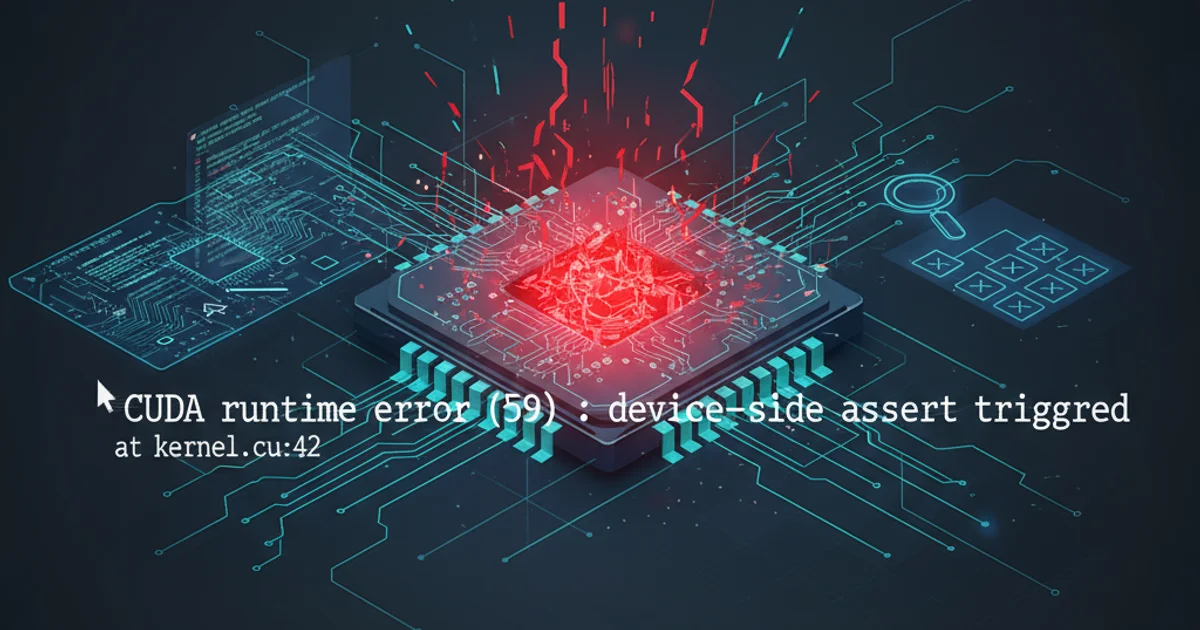
Debugging CUDA Runtime Error (59): Device-Side Assert Triggered in PyTorch
Unravel the mysteries behind CUDA runtime error (59) in PyTorch, a common issue indicating a device-side assertion failure. Learn how to diagnose, debug, and resolve this error effectively in your Python and PyTorch projects.
The CUDA runtime error (59): device-side assert triggered is a cryptic but common error encountered by developers working with PyTorch and CUDA-enabled GPUs. This error signifies that an assertion failed on the GPU itself, often due to invalid memory access, out-of-bounds indexing, or other illegal operations within a CUDA kernel. Unlike CPU errors that provide detailed stack traces, device-side asserts are notoriously difficult to debug because the error occurs asynchronously on the GPU, and the Python traceback often points to the CUDA call site rather than the actual line of code causing the issue.
Understanding the 'Device-Side Assert Triggered' Error
When a CUDA kernel executes on the GPU, it can contain assert statements, similar to those in C++ or Python. If one of these assertions fails, the GPU signals an error. The CUDA runtime error (59) is PyTorch's way of reporting this underlying CUDA error. The challenge lies in the fact that the error message itself doesn't tell you where in your code the assertion failed, only that it failed. This is because the Python code merely launches the kernel; the actual computation and error occur on a separate device (the GPU) asynchronously.
flowchart TD
    A[Python Code Launches CUDA Kernel] --> B{Kernel Executes on GPU}
    B --> C{Assertion Check within Kernel}
    C -- Fails --> D[Device-Side Assert Triggered]
    D --> E["CUDA runtime error (59)" Reported to Python]
    C -- Passes --> F[Kernel Completes Successfully]
    E --> G{Debugging Challenge: Asynchronous Error}
Flow of a CUDA device-side assert error
Common Causes and Initial Debugging Steps
This error often stems from issues like:
- Out-of-bounds indexing: Accessing elements beyond the allocated size of a tensor.
- Invalid memory access: Attempting to read from or write to unallocated or protected memory.
- NaN/Inf values: Propagating
NaN(Not a Number) orInf(Infinity) values that lead to illegal operations. - Incorrect tensor shapes/dimensions: Mismatched dimensions in operations that expect specific layouts.
- Data type mismatches: Performing operations with incompatible data types.
To begin debugging, the most crucial step is to enable synchronous error reporting, which forces the Python runtime to wait for CUDA kernel completion and report errors immediately. This often provides a more precise traceback.
import os
os.environ['CUDA_LAUNCH_BLOCKING'] = '1'

import torch

# Your PyTorch code here
# Example of a common cause: out-of-bounds indexing
try:
    x = torch.randn(5, 5).cuda()
    # This will cause an error if accessed out of bounds
    _ = x[10, 10] # Accessing index 10,10 on a 5x5 tensor
except RuntimeError as e:
    print(f"Caught expected error: {e}")
Enabling CUDA_LAUNCH_BLOCKING for synchronous error reporting
CUDA_LAUNCH_BLOCKING=1 is your first and most important step. It forces CUDA operations to be synchronous, meaning Python will wait for the GPU to finish before proceeding. This makes the traceback point closer to the actual error source.Advanced Debugging Techniques
If CUDA_LAUNCH_BLOCKING=1 doesn't immediately pinpoint the issue, you'll need to employ more granular debugging strategies:
1. Check for NaN/Inf Values
NaN or Inf values can propagate and cause unexpected behavior or assertions. Regularly check your tensor values, especially after operations that might introduce them (e.g., division by zero, log(0)).
2. Validate Tensor Shapes and Dtypes
Incorrect tensor shapes are a frequent culprit. Use tensor.shape and tensor.dtype to inspect your tensors at various stages of your computation. Pay close attention to broadcasting rules and expected input dimensions for PyTorch operations.
3. Reduce Batch Size and Simplify Model
If the error occurs during training, try reducing your batch size to 1. This can sometimes isolate the problematic sample. Additionally, simplify your model or remove custom layers to narrow down the source of the error.
4. Use PyTorch's Anomaly Detection
PyTorch offers an anomaly detection mode that can help catch operations that produce NaN or Inf values, or other runtime errors. While it adds overhead, it can be invaluable for debugging.
import torch

with torch.autograd.set_detect_anomaly(True):
    # Your PyTorch training/inference loop
    # Example: a division by zero leading to NaN
    a = torch.tensor([1.0, 2.0]).cuda()
    b = torch.tensor([0.0, 1.0]).cuda()
    try:
        c = a / b # This will produce Inf/NaN
        loss = c.sum()
        loss.backward()
    except RuntimeError as e:
        print(f"Anomaly detected: {e}")
Using PyTorch's anomaly detection to catch runtime issues
set_detect_anomaly(True)) adds significant overhead and should only be used for debugging, not in production environments.Systematic Isolation and Verification
When all else fails, a systematic approach to isolating the problematic code segment is necessary. This involves commenting out parts of your code or running operations one by one to see which specific line triggers the error. You can also move tensors to the CPU (.cpu()) to verify intermediate results without GPU acceleration, which can help confirm if the issue is GPU-specific or a general logic error.
1. Enable CUDA_LAUNCH_BLOCKING
Set the environment variable os.environ['CUDA_LAUNCH_BLOCKING'] = '1' at the very beginning of your script to get more informative tracebacks.
2. Inspect Tensor Properties
After each significant operation, print tensor.shape, tensor.dtype, and tensor.min(), tensor.max(), tensor.isnan().any(), tensor.isinf().any() to check for unexpected values or dimensions.
3. Activate Anomaly Detection
Wrap suspicious code blocks with with torch.autograd.set_detect_anomaly(True): to get detailed error messages about operations producing NaN or Inf.
4. Simplify and Isolate
Reduce your model complexity, use smaller inputs, or comment out sections of code to pinpoint the exact operation causing the assert. Consider moving tensors to CPU for intermediate checks if the error persists on GPU.