Any effective opensource alternative for New Relic for Java
Categories:
Open-Source Alternatives to New Relic for Java Application Monitoring
Explore effective open-source solutions for monitoring Java applications, offering robust performance testing and application server insights without proprietary vendor lock-in.
New Relic is a powerful Application Performance Monitoring (APM) tool, but its proprietary nature and cost can be prohibitive for many organizations. Fortunately, the open-source community offers a rich ecosystem of tools that can provide comparable, if not superior, monitoring capabilities for Java applications. This article delves into some of the most effective open-source alternatives, focusing on their strengths in performance testing, application server monitoring, and overall observability.
Understanding the Core Components of APM
Before diving into specific tools, it's crucial to understand the fundamental aspects of APM that these open-source alternatives aim to cover. A comprehensive APM solution typically includes:
- Metrics Collection: Gathering data on CPU usage, memory, network I/O, garbage collection, and custom application metrics.
- Distributed Tracing: Tracking requests as they flow through various services in a microservices architecture, identifying bottlenecks.
- Log Management: Centralized collection, analysis, and visualization of application and server logs.
- Alerting and Notification: Proactive alerts based on predefined thresholds or anomalies.
- Dashboarding and Visualization: Creating custom dashboards to visualize key performance indicators (KPIs) and system health.
Open-source solutions often achieve these capabilities by combining several specialized tools, forming a powerful monitoring stack.
flowchart TD
    A[Java Application] --> B(Metrics Exporter)
    B --> C[Prometheus Server]
    A --> D(Tracing Agent)
    D --> E[Jaeger/Zipkin Collector]
    A --> F(Logging Framework)
    F --> G[Logstash/Fluentd]
    C --> H[Grafana]
    E --> H
    G --> H
    H[Grafana] --> I{Alerting & Dashboards}
Typical Open-Source APM Stack Architecture for Java
Prometheus and Grafana: The Dynamic Duo for Metrics
Prometheus has become the de-facto standard for time-series monitoring in cloud-native environments. It's excellent for collecting numerical metrics from your Java applications and infrastructure. When paired with Grafana, a powerful visualization tool, you get a highly customizable and scalable monitoring solution.
Prometheus Strengths:
- Pull-based Model: Actively scrapes metrics endpoints, making it easy to integrate with various services.
- Powerful Query Language (PromQL): Enables complex data aggregation and analysis.
- Service Discovery: Integrates well with Kubernetes and other dynamic environments.
Grafana Strengths:
- Rich Visualization: Supports a wide array of chart types and dashboard layouts.
- Multi-Source Support: Can pull data from Prometheus, Elasticsearch, Loki, and many other data sources.
- Alerting: Configurable alerts with various notification channels.
For Java applications, you'd typically use client libraries like micrometer or Prometheus Java client to expose application metrics in a format that Prometheus can scrape.
import io.micrometer.core.instrument.Counter;
import io.micrometer.core.instrument.MeterRegistry;
import io.micrometer.prometheus.PrometheusMeterRegistry;
import io.prometheus.client.exporter.HTTPServer;

public class MetricsExample {

    public static void main(String[] args) throws Exception {
        PrometheusMeterRegistry prometheusRegistry = new PrometheusMeterRegistry(io.prometheus.client.CollectorRegistry.defaultRegistry);

        // Expose Prometheus metrics endpoint
        HTTPServer server = new HTTPServer(8080);

        // Create a counter
        Counter requestCounter = Counter.builder("http_requests_total")
                .description("Total number of HTTP requests")
                .tag("status", "200")
                .register(prometheusRegistry);

        requestCounter.increment();
        System.out.println("Metrics exposed on http://localhost:8080/metrics");

        // Keep the server running
        Thread.currentThread().join();
    }
}
Exposing Java application metrics using Micrometer and Prometheus client
Distributed Tracing with Jaeger or Zipkin
For modern microservices architectures, understanding how requests propagate across multiple services is critical. Distributed tracing tools like Jaeger and Zipkin provide this visibility, helping to pinpoint latency issues and errors within complex systems.
Both Jaeger and Zipkin are based on the OpenTracing and OpenTelemetry standards, making them highly interoperable. They allow you to visualize the entire lifecycle of a request, showing the time spent in each service and component.
Key Features:
- Trace Visualization: Gantt charts showing spans and their durations.
- Root Cause Analysis: Quickly identify which service or operation is causing performance degradation.
- Context Propagation: Automatically pass trace context between services.
Integrating these tools into Java applications typically involves using OpenTelemetry SDKs, which provide auto-instrumentation agents or manual instrumentation APIs.
<dependency>
    <groupId>io.opentelemetry</groupId>
    <artifactId>opentelemetry-api</artifactId>
    <version>1.32.0</version>
</dependency>
<dependency>
    <groupId>io.opentelemetry</groupId>
    <artifactId>opentelemetry-sdk</artifactId>
    <version>1.32.0</version>
</dependency>
<dependency>
    <groupId>io.opentelemetry</groupId>
    <artifactId>opentelemetry-exporter-jaeger</artifactId>
    <version>1.32.0</version>
</dependency>
Maven dependencies for OpenTelemetry with Jaeger exporter
Log Management with ELK Stack (Elasticsearch, Logstash, Kibana) or Loki
Logs are an invaluable source of information for debugging and understanding application behavior. The ELK stack (Elasticsearch, Logstash, Kibana) has long been the standard for centralized log management. More recently, Loki, inspired by Prometheus, has emerged as a lightweight alternative for log aggregation.
ELK Stack Strengths:
- Powerful Search and Analytics: Elasticsearch provides full-text search and complex aggregations.
- Flexible Data Ingestion: Logstash can process and transform logs from various sources.
- Rich Visualization: Kibana offers extensive dashboarding and exploration capabilities.
Loki Strengths:
- Cost-Effective: Stores only metadata and indexes logs by labels, reducing storage requirements.
- Prometheus-like Query Language (LogQL): Familiar syntax for users already using PromQL.
- Scalable: Designed for cloud-native environments.
For Java applications, you would typically configure your logging framework (e.g., Logback, Log4j2) to send logs to a log collector like Logstash, Fluentd, or directly to Loki.
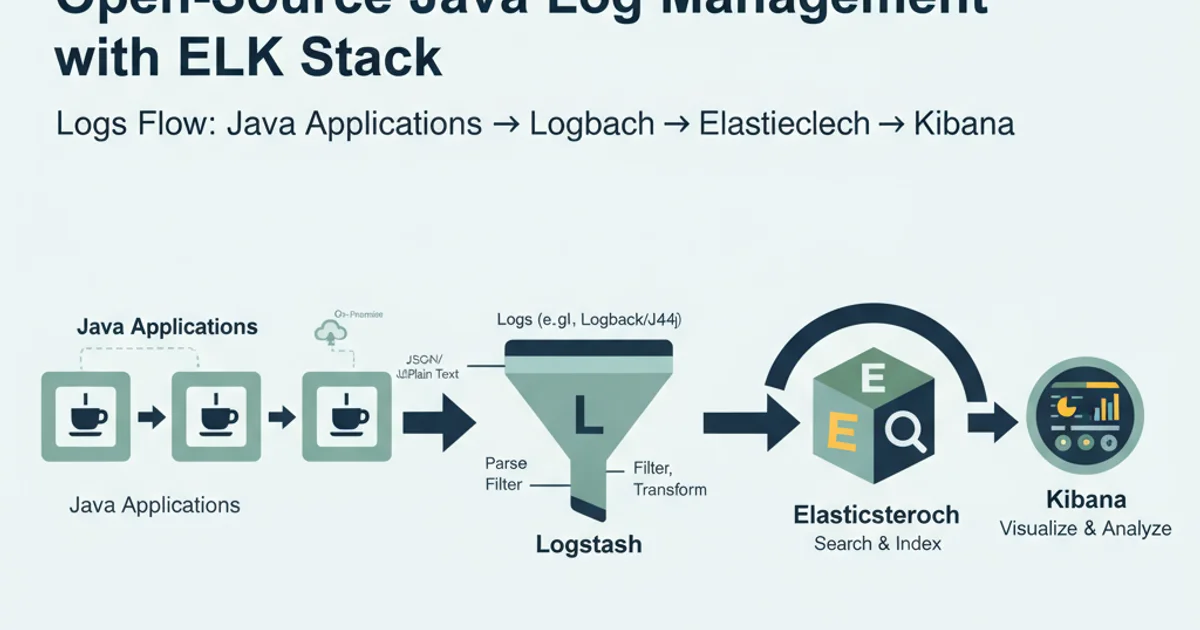
Log management with the ELK Stack