How to display the request sent time and the response received time in Fiddler?
Categories:
Mastering Fiddler: Displaying Request Sent and Response Received Times
Learn how to configure Fiddler to accurately display the exact time a request was sent and a response was received, crucial for web performance analysis and debugging.
Fiddler is an indispensable tool for web debugging, allowing developers and testers to inspect HTTP/HTTPS traffic. While Fiddler provides a wealth of information about each session, pinpointing the exact 'request sent' and 'response received' timestamps can be crucial for performance analysis, especially when diagnosing latency issues or understanding network behavior. This article will guide you through configuring Fiddler to expose these precise timings.
Understanding Fiddler's Timing Metrics
Fiddler captures various timing metrics for each session, which are typically displayed in the 'Timings' tab of the Inspectors panel. However, these often show durations (e.g., 'ClientConnected', 'ClientBeginRequest', 'ServerGotRequest', 'ServerBeginResponse', 'GotResponseHeaders', 'ClientDoneResponse') rather than absolute timestamps. To get the exact sent and received times, we need to customize Fiddler's column display.
sequenceDiagram
    participant Client
    participant Fiddler
    participant Server

    Client->>Fiddler: Request (ClientBeginRequest)
    Fiddler->>Server: Request (ServerGotRequest)
    Server-->>Fiddler: Response (ServerBeginResponse)
    Fiddler-->>Client: Response (ClientDoneResponse)

    note over Client,Server: Fiddler captures timestamps at each stage
Simplified sequence diagram of HTTP request/response flow with Fiddler interception points.
Customizing Fiddler Columns for Timestamps
Fiddler allows extensive customization of the columns displayed in the Web Sessions list. By adding specific session flags, you can show the precise date and time for when the client sent the request and when the client received the full response. This is a powerful feature for detailed performance analysis.
1. Open Fiddler and Access Column Customization
Launch Fiddler. Navigate to Tools > Options... from the top menu. In the Options dialog, select the Columns tab.
2. Add 'Request Sent' Column
In the Columns tab, click the dropdown menu labeled Choose from the following session flags: and select Request Sent. Click the Add button to add it to the list of displayed columns. You can use the Move Up and Move Down buttons to position it as desired.
3. Add 'Response Received' Column
Repeat the previous step: from the Choose from the following session flags: dropdown, select Response Received. Click Add and position it appropriately.
4. Apply Changes
Click OK to close the Options dialog. The new columns, 'Request Sent' and 'Response Received', will now appear in your Fiddler Web Sessions list, showing the exact timestamps for each session.
Interpreting the Timestamps
Once the columns are added, you'll see timestamps like 2023-10-27 10:30:05.123 for 'Request Sent' and 2023-10-27 10:30:05.456 for 'Response Received'. The difference between these two values, along with other timing metrics, can help you understand where latency is occurring. A large gap between 'Request Sent' and 'Response Received' might indicate server processing delays, network congestion, or a slow response body transfer.
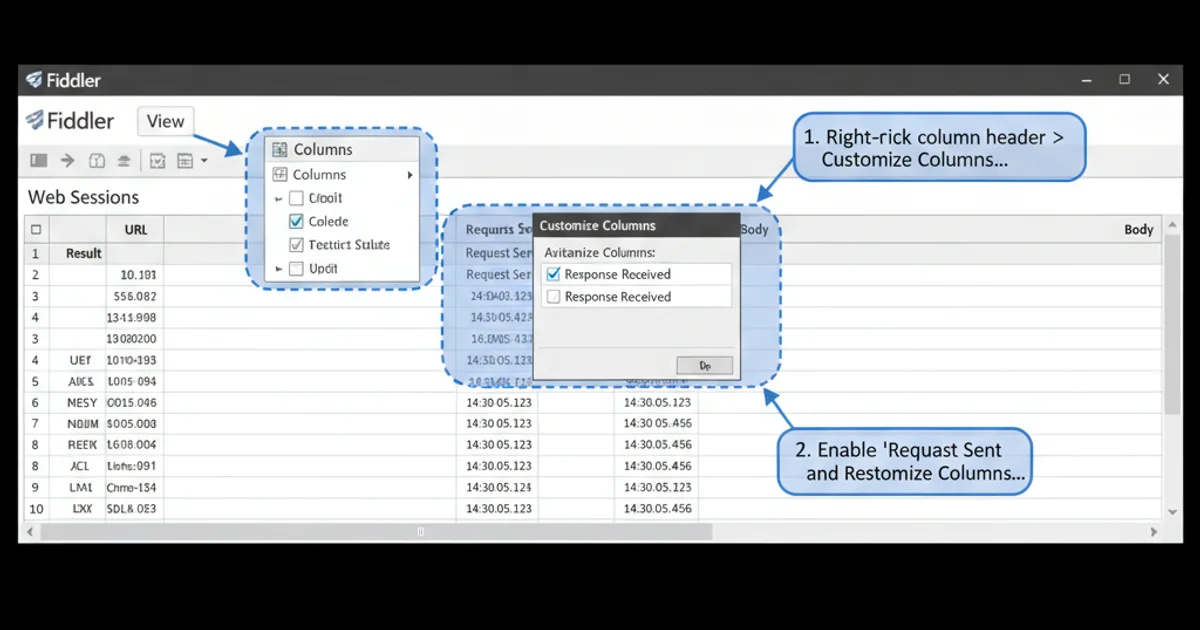
Fiddler showing custom 'Request Sent' and 'Response Received' columns.