HOW TO DRAW YAMAZUMI CHARTS USING VB.NET
Categories:
Mastering Yamazumi Charts in VB.NET for Process Analysis
Learn how to create dynamic Yamazumi charts in VB.NET to visualize process cycle times, identify bottlenecks, and optimize workflows for manufacturing and service industries.
Yamazumi charts, also known as stacked bar charts for process analysis, are powerful tools in Lean manufacturing and Six Sigma methodologies. They visually represent the cycle time of individual process steps, allowing for easy identification of bottlenecks, non-value-added activities, and opportunities for process improvement. This article will guide you through the process of drawing Yamazumi charts using VB.NET, focusing on data preparation, chart rendering, and customization.
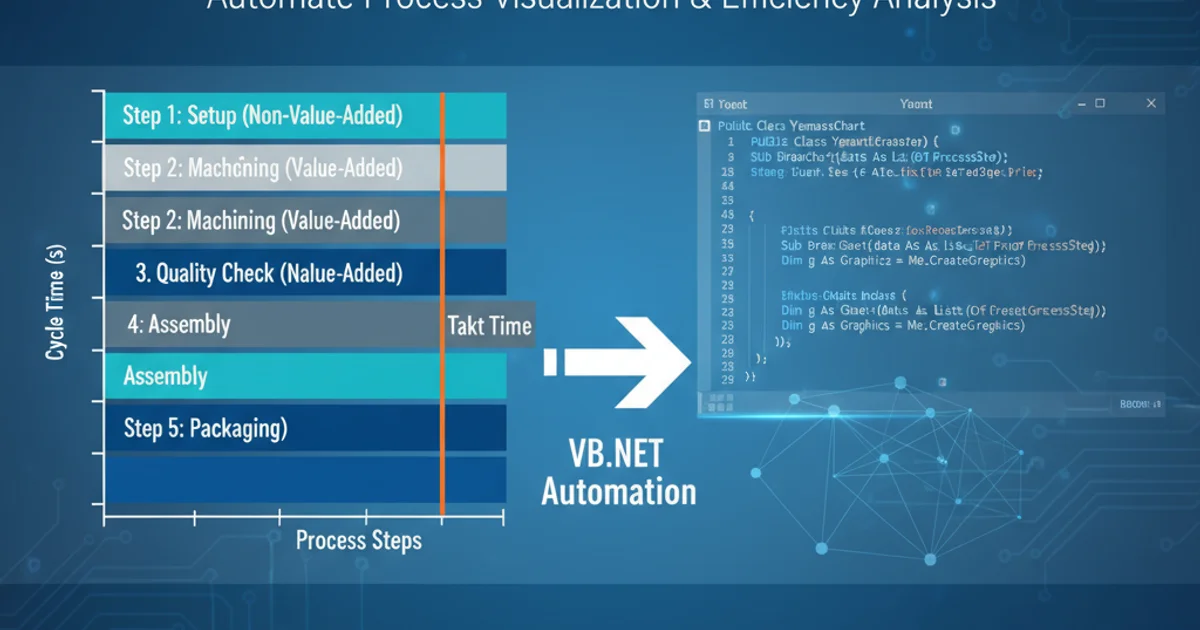
Understanding Yamazumi Chart Components
Before diving into the code, it's crucial to understand the core components of a Yamazumi chart. Each bar typically represents a workstation or a major process step, and within each bar, segments represent individual tasks or sub-steps. These segments are stacked, with their height corresponding to the time taken for that specific task. Different colors often distinguish between value-added, non-value-added but necessary, and pure waste activities. A target Takt Time line is usually superimposed to provide a benchmark for comparison.
flowchart TD
    A["Gather Process Data (Task, Time, Type)"] --> B{"Define Chart Structure"}
    B --> C["Create Data Series for Each Activity Type"]
    C --> D["Plot Stacked Bars (Workstation/Process Step)"]
    D --> E["Add Takt Time Line"]
    E --> F["Customize Appearance (Colors, Labels)"]
    F --> G["Display Chart"]
    G --> H["Analyze & Optimize"]
Workflow for creating a Yamazumi chart.
Data Preparation for Charting
The foundation of any good chart is well-structured data. For a Yamazumi chart, you'll typically need data that includes the process step or workstation, the individual task performed, the time taken for that task, and optionally, the type of activity (e.g., Value-Added, Non-Value-Added, Waste). We'll use a simple DataTable or a custom class to hold this information, making it easy to bind to charting controls.
Public Class ProcessStep
    Public Property Workstation As String
    Public Property TaskName As String
    Public Property CycleTime As Double
    Public Property ActivityType As String ' e.g., "VA", "NVA", "Waste"
End Class

' Example data loading
Private Function GetYamazumiData() As List(Of ProcessStep)
    Dim data As New List(Of ProcessStep)
    data.Add(New ProcessStep With {.Workstation = "Assembly 1", .TaskName = "Fasten Part A", .CycleTime = 15, .ActivityType = "VA"})
    data.Add(New ProcessStep With {.Workstation = "Assembly 1", .TaskName = "Inspect Part A", .CycleTime = 5, .ActivityType = "NVA"})
    data.Add(New ProcessStep With {.Workstation = "Assembly 1", .TaskName = "Wait for Part B", .CycleTime = 10, .ActivityType = "Waste"})
    data.Add(New ProcessStep With {.Workstation = "Assembly 2", .TaskName = "Fasten Part B", .CycleTime = 20, .ActivityType = "VA"})
    data.Add(New ProcessStep With {.Workstation = "Assembly 2", .TaskName = "Move to next station", .CycleTime = 8, .ActivityType = "NVA"})
    Return data
End Function
Defining a ProcessStep class and example data loading function.
Drawing the Yamazumi Chart with System.Windows.Forms.DataVisualization.Charting
VB.NET applications can leverage the built-in Chart control (available in System.Windows.Forms.DataVisualization.Charting) to create sophisticated charts. To draw a Yamazumi chart, we'll use a StackedColumn chart type. The key is to create multiple series, one for each activity type (e.g., Value-Added, Non-Value-Added), and then iterate through your process steps to add data points to the appropriate series.
Imports System.Windows.Forms.DataVisualization.Charting

Private Sub CreateYamazumiChart()
    Dim chartData = GetYamazumiData()
    Dim chart1 As New Chart()
    chart1.Size = New Size(800, 600)
    chart1.ChartAreas.Add("ChartArea1")
    chart1.ChartAreas("ChartArea1").AxisY.Title = "Cycle Time (seconds)"
    chart1.ChartAreas("ChartArea1").AxisX.Title = "Workstation / Process Step"
    chart1.ChartAreas("ChartArea1").AxisY.Minimum = 0

    ' Define series for different activity types
    Dim vaSeries As New Series("Value-Added") With {.ChartType = SeriesChartType.StackedColumn, .Color = Color.Green}
    Dim nvaSeries As New Series("Non-Value-Added") With {.ChartType = SeriesChartType.StackedColumn, .Color = Color.Orange}
    Dim wasteSeries As New Series("Waste") With {.ChartType = SeriesChartType.StackedColumn, .Color = Color.Red}

    chart1.Series.Add(vaSeries)
    chart1.Series.Add(nvaSeries)
    chart1.Series.Add(wasteSeries)

    ' Group data by workstation
    Dim groupedData = chartData.GroupBy(Function(p) p.Workstation)

    For Each group In groupedData
        Dim workstation = group.Key
        Dim vaTime As Double = 0
        Dim nvaTime As Double = 0
        Dim wasteTime As Double = 0

        For Each step In group
            Select Case step.ActivityType
                Case "VA"
                    vaTime += step.CycleTime
                Case "NVA"
                    nvaTime += step.CycleTime
                Case "Waste"
                    wasteTime += step.CycleTime
            End Select
        Next

        ' Add data points for each workstation
        vaSeries.Points.AddXY(workstation, vaTime)
        nvaSeries.Points.AddXY(workstation, nvaTime)
        wasteSeries.Points.AddXY(workstation, wasteTime)
    Next

    ' Add Takt Time line (example: 30 seconds)
    Dim taktTime As Double = 30
    Dim taktLine As New StripLine()
    taktLine.Interval = 0
    taktLine.StripWidth = 0.5 ' Make it a thin line
    taktLine.BorderColor = Color.Blue
    taktLine.BorderWidth = 2
    taktLine.Text = "Takt Time"
    taktLine.TextLineAlignment = StringAlignment.Far
    taktLine.TextAlignment = StringAlignment.Far
    taktLine.StripWidth = 0 ' This makes it a line, not a strip
    taktLine.IntervalOffset = taktTime
    chart1.ChartAreas("ChartArea1").AxisY.StripLines.Add(taktLine)

    ' Add chart to a form or panel
    Me.Controls.Add(chart1)
End Sub
VB.NET code to generate a Yamazumi chart using the Chart control.
DataPoint objects and setting their AxisLabel property for workstation names, or binding directly to a DataTable if your data structure is flat.Customization and Enhancements
The Chart control offers extensive customization options. You can enhance your Yamazumi chart by:
- Adding Tooltips: Display detailed information (task name, exact time) when hovering over segments.
- Dynamic Takt Time: Allow users to input or calculate Takt Time based on production requirements.
- Legend Customization: Adjust legend position, font, and appearance.
- Export Options: Enable saving the chart as an image (e.g., PNG, JPEG).
- Interactive Features: Implement zooming, panning, or drill-down capabilities for deeper analysis.
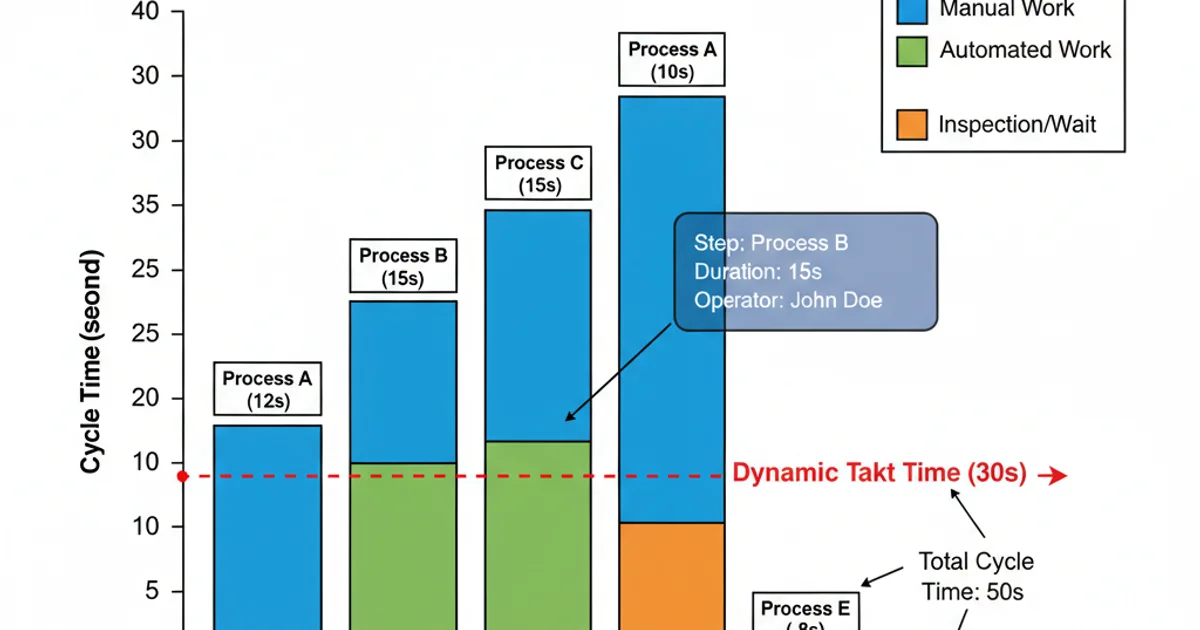
Example of a customized Yamazumi chart with enhanced features.
DivideByZeroException if calculating Takt Time based on available working time and customer demand, especially if demand is zero.