How to define the amount of the error bar in VBA excel
Categories:
Defining Error Bar Amounts in Excel VBA Charts

Learn how to programmatically control the amount and type of error bars in Excel charts using VBA, enhancing data visualization accuracy.
Error bars are a crucial component of scientific and statistical charts, providing a visual representation of the variability or uncertainty in data points. While Excel offers built-in options to add error bars manually, automating this process with VBA (Visual Basic for Applications) provides greater control, consistency, and efficiency, especially when dealing with dynamic data or multiple charts. This article will guide you through the process of defining and customizing error bar amounts programmatically in Excel using VBA.
Understanding Error Bar Types and Properties
Before diving into the code, it's essential to understand the different types of error bars and their associated properties in Excel. Error bars can represent standard error, standard deviation, percentage, fixed value, or custom values. Each type has specific properties that determine its appearance and calculation. When working with VBA, you'll primarily interact with the ErrorBars object, which is a property of a Series object within a chart.
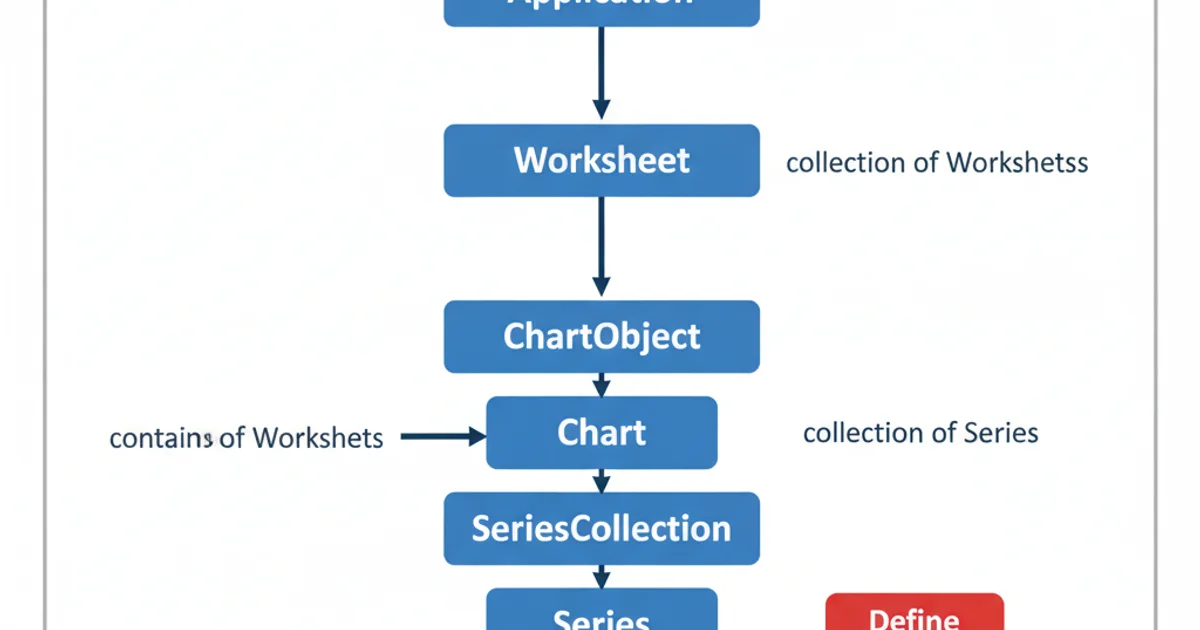
Excel Chart Object Model for Error Bars
Setting Fixed Value Error Bars
One of the simplest ways to define error bar amounts is by setting a fixed value. This is useful when you know the exact margin of error or uncertainty for your data points. You can specify separate positive and negative error amounts, or use a single value for both. The ErrorBar method of the Series object is key here, along with properties like Type, Direction, PlusValues, and MinusValues.
Sub SetFixedErrorBars()
    Dim ws As Worksheet
    Dim ch As Chart
    Dim ser As Series

    ' Set the worksheet and chart
    Set ws = ThisWorkbook.Sheets("Sheet1")
    Set ch = ws.ChartObjects(1).Chart ' Assumes the first chart on Sheet1

    ' Get the first series in the chart
    Set ser = ch.SeriesCollection(1)

    With ser
        ' Add error bars (if not already present) and set type to Fixed Value
        .HasErrorBars = True
        .ErrorBars.Type = xlErrorBarTypeFixedValue

        ' Set the direction (both positive and negative)
        .ErrorBars.Direction = xlBoth

        ' Set the fixed positive and negative error amounts
        .ErrorBars.PlusValues = 5 ' Example: +5 units
        .ErrorBars.MinusValues = 3 ' Example: -3 units

        ' Optional: Format error bars
        .ErrorBars.Border.Color = RGB(255, 0, 0) ' Red color
        .ErrorBars.Border.Weight = xlThin
    End With

    MsgBox "Fixed error bars applied successfully!", vbInformation
End Sub
VBA code to set fixed value error bars for a chart series.
On Error Resume Next can help prevent runtime errors if the chart or series doesn't exist, but it's better to validate their existence explicitly.Using Custom Error Bar Values from a Range
For more dynamic and data-driven error bars, you can specify custom positive and negative error amounts directly from a range of cells in your worksheet. This is particularly powerful when your error values are calculated based on statistical analysis or external data. The PlusValues and MinusValues properties can accept a range reference as a string.
Sub SetCustomErrorBarsFromRange()
    Dim ws As Worksheet
    Dim ch As Chart
    Dim ser As Series

    ' Set the worksheet and chart
    Set ws = ThisWorkbook.Sheets("Sheet1")
    Set ch = ws.ChartObjects(1).Chart ' Assumes the first chart on Sheet1

    ' Get the first series in the chart
    Set ser = ch.SeriesCollection(1)

    ' Ensure your custom error values are in a range, e.g., B2:B5 for positive and C2:C5 for negative
    ' Make sure the number of values in the range matches the number of data points in the series.

    With ser
        .HasErrorBars = True
        .ErrorBars.Type = xlErrorBarTypeCustom
        .ErrorBars.Direction = xlBoth

        ' Set the ranges for custom positive and negative error values
        ' IMPORTANT: The range must be a string, e.g., "=Sheet1!$B$2:$B$5"
        .ErrorBars.PlusValues = "=Sheet1!$B$2:$B$5" ' Example: Positive errors from B2:B5
        .ErrorBars.MinusValues = "=Sheet1!$C$2:$C$5" ' Example: Negative errors from C2:C5

        ' Optional: Format error bars
        .ErrorBars.Border.Color = RGB(0, 0, 255) ' Blue color
        .ErrorBars.Border.Weight = xlMedium
    End With

    MsgBox "Custom error bars from range applied successfully!", vbInformation
End Sub
VBA code to set custom error bars using values from specified worksheet ranges.
PlusValues and MinusValues ranges must exactly match the number of data points in the series. Mismatched ranges will result in a runtime error.Other Error Bar Types (Standard Error, Percentage, Standard Deviation)
Beyond fixed and custom values, VBA also allows you to set error bars based on statistical calculations. These types automatically derive their values from the series data itself. You simply need to set the Type property of the ErrorBars object.
Sub SetStatisticalErrorBars()
    Dim ws As Worksheet
    Dim ch As Chart
    Dim ser As Series

    Set ws = ThisWorkbook.Sheets("Sheet1")
    Set ch = ws.ChartObjects(1).Chart
    Set ser = ch.SeriesCollection(1)

    With ser
        .HasErrorBars = True
        .ErrorBars.Direction = xlBoth

        ' Example 1: Standard Error
        ' .ErrorBars.Type = xlErrorBarTypeStDev ' For Standard Deviation
        ' .ErrorBars.Type = xlErrorBarTypeStError ' For Standard Error

        ' Example 2: Percentage (e.g., 10% error)
        .ErrorBars.Type = xlErrorBarTypePercentage
        .ErrorBars.Amount = 10 ' Sets 10% for both positive and negative

        ' Example 3: Standard Deviation (uncomment to use)
        ' .ErrorBars.Type = xlErrorBarTypeStDev
        ' .ErrorBars.Amount = 1 ' Sets 1 standard deviation

        ' Optional: Format error bars
        .ErrorBars.Border.Color = RGB(0, 128, 0) ' Green color
    End With

    MsgBox "Statistical error bars applied successfully!", vbInformation
End Sub
VBA code to set percentage-based error bars (can be adapted for Standard Deviation or Standard Error).
xlErrorBarTypePercentage, xlErrorBarTypeStDev, and xlErrorBarTypeStError, the Amount property is used to specify the percentage or number of standard deviations/errors. For xlErrorBarTypeFixedValue and xlErrorBarTypeCustom, use PlusValues and MinusValues.1. Prepare Your Data and Chart
Ensure you have your data organized in an Excel worksheet and a chart (e.g., a column or line chart) already created. If using custom error bars, make sure your positive and negative error values are in separate, accessible ranges.
2. Open the VBA Editor
Press Alt + F11 to open the VBA editor. In the Project Explorer, right-click on your workbook and select Insert > Module to create a new module for your code.
3. Insert and Modify VBA Code
Copy and paste one of the provided VBA subroutines into your new module. Modify the Sheet1 and ChartObjects(1) references to match your specific worksheet name and chart index. Adjust the PlusValues and MinusValues ranges if you are using custom error bars.
4. Run the Macro
Place your cursor inside the subroutine you want to run and press F5, or go to Developer > Macros, select your macro, and click Run. Observe your chart to see the error bars applied.
5. Refine and Customize
Experiment with different ErrorBarType values, Direction settings, and formatting options (like Border.Color, Border.Weight) to achieve the desired visual representation for your error bars.