Simple stripchart in C++ / Qt
Categories:
Creating a Simple Stripchart in C++ with Qt

Learn how to implement a basic real-time stripchart for data visualization using Qt's QCustomPlot library, ideal for monitoring sensor data or system metrics.
Stripcharts are essential tools for visualizing time-series data in real-time. They are commonly used in scientific applications, industrial monitoring, and embedded systems to display sensor readings, system performance, or other continuously changing values. This article will guide you through creating a simple yet effective stripchart application using C++ and the Qt framework, leveraging the powerful QCustomPlot library for plotting.
Understanding the Components
Before diving into the code, let's outline the key components required for our stripchart application. We'll need a way to generate data, a plotting widget to display it, and a timer to update the plot periodically. The QCustomPlot library simplifies the plotting aspect significantly, providing a robust and easy-to-use API for creating various types of plots, including real-time graphs.
flowchart TD
    A[Data Source (e.g., Sensor, Simulation)] --> B[Qt Application]
    B --> C{Timer Event Triggered?}
    C -- Yes --> D[Generate/Read New Data Point]
    D --> E[Add Data to QCustomPlot Graph]
    E --> F[Rescale Axes (Optional)]
    F --> G[Replot QCustomPlot]
    C -- No --> B
Basic Stripchart Data Flow
Setting Up Your Qt Project
First, ensure you have Qt installed and a basic Qt Widgets Application project set up. You'll also need to integrate QCustomPlot into your project. The easiest way is to download the qcustomplot.h and qcustomplot.cpp files and add them to your project's source directory. Then, include them in your .pro file or CMakeLists.txt.
# In your .pro file:
QT += widgets

SOURCES += \
    main.cpp \
    mainwindow.cpp \
    qcustomplot.cpp

HEADERS += \
    mainwindow.h \
    qcustomplot.h

# For CMakeLists.txt (example):
# add_executable(MyStripchartApp main.cpp mainwindow.cpp qcustomplot.cpp)
# target_link_libraries(MyStripchartApp Qt::Widgets)
Adding QCustomPlot to your Qt project file
qmake (for .pro files) or re-configure your CMake project after adding QCustomPlot files to ensure they are properly included in your build.Implementing the Stripchart Logic
The core of our stripchart will reside in the MainWindow class. We'll add a QCustomPlot widget to our UI, configure a graph, and use a QTimer to periodically add new data points and update the plot. For simplicity, we'll generate random data, but this can easily be replaced with actual sensor readings or other data sources.
// mainwindow.h
#ifndef MAINWINDOW_H
#define MAINWINDOW_H

#include <QMainWindow>
#include <QTimer>
#include "qcustomplot.h"

QT_BEGIN_NAMESPACE
namespace Ui { class MainWindow; }
QT_END_NAMESPACE

class MainWindow : public QMainWindow
{
    Q_OBJECT

public:
    MainWindow(QWidget *parent = nullptr);
    ~MainWindow();

private slots:
    void realTimeDataSlot();

private:
    Ui::MainWindow *ui;
    QTimer *dataTimer;
    double timeElapsed;
};
#endif // MAINWINDOW_H
Header file for MainWindow, including QCustomPlot and QTimer
// mainwindow.cpp
#include "mainwindow.h"
#include "ui_mainwindow.h"
#include <QRandomGenerator>

MainWindow::MainWindow(QWidget *parent)
    : QMainWindow(parent)
    , ui(new Ui::MainWindow)
{
    ui->setupUi(this);

    // Add QCustomPlot widget to the layout (assuming you have a QWidget named 'plotWidget' in your UI)
    // If not, you can create it programmatically: ui->customPlot = new QCustomPlot(this);
    // and then add it to a layout.
    ui->customPlot->addGraph(); // Add a graph to the plot
    ui->customPlot->graph(0)->setPen(QPen(Qt::blue)); // Set graph line color
    ui->customPlot->graph(0)->setBrush(QBrush(QColor(0, 0, 255, 20))); // Set graph fill color

    // Configure x-axis (time axis)
    ui->customPlot->xAxis->setLabel("Time (s)");
    ui->customPlot->xAxis->setTickLabelType(QCPAxis::ltDateTime);
    ui->customPlot->xAxis->setDateTimeFormat("hh:mm:ss");
    ui->customPlot->xAxis->setAutoTickStep(false);
    ui->customPlot->xAxis->setTickStep(2); // Tick every 2 seconds
    ui->customPlot->xAxis->setRange(0, 10); // Initial range of 10 seconds

    // Configure y-axis (value axis)
    ui->customPlot->yAxis->setLabel("Value");
    ui->customPlot->yAxis->setRange(-1.2, 1.2); // Initial value range

    // Make top and right axes visible, but without ticks and labels
    ui->customPlot->xAxis2->setVisible(true);
    ui->customPlot->xAxis2->setTickLabels(false);
    ui->customPlot->yAxis2->setVisible(true);
    ui->customPlot->yAxis2->setTickLabels(false);

    // Connect slots for interaction (optional)
    connect(ui->customPlot->xAxis, SIGNAL(rangeChanged(QCPRange)), ui->customPlot->xAxis2, SLOT(setRange(QCPRange)));
    connect(ui->customPlot->yAxis, SIGNAL(rangeChanged(QCPRange)), ui->customPlot->yAxis2, SLOT(setRange(QCPRange)));

    // Setup timer for real-time data updates
    dataTimer = new QTimer(this);
    connect(dataTimer, &QTimer::timeout, this, &MainWindow::realTimeDataSlot);
    dataTimer->start(50); // Update every 50 ms (20 Hz)

    timeElapsed = 0;
}

MainWindow::~MainWindow()
{
    delete ui;
}

void MainWindow::realTimeDataSlot()
{
    static QTime time(QTime::currentTime());
    // Calculate elapsed time in seconds since start of application
    double key = time.elapsed() / 1000.0;

    // Add data to graph (example: sine wave with noise)
    double value = qSin(key) + QRandomGenerator::global()->generateDouble() * 0.1;
    ui->customPlot->graph(0)->addData(key, value);

    // Remove data that has left the visible range
    ui->customPlot->graph(0)->removeDataBefore(key - 10); // Keep 10 seconds of data visible

    // Rescale x-axis to show the latest data
    ui->customPlot->xAxis->setRange(key, 10, Qt::AlignRight); // Show latest 10 seconds
    ui->customPlot->replot();
}
MainWindow implementation for the stripchart
realTimeDataSlot(), ui->customPlot->xAxis->setRange(key, 10, Qt::AlignRight); ensures that the x-axis always displays the last 10 seconds of data, effectively making it a scrolling stripchart. The removeDataBefore() call prevents the graph from accumulating an infinite amount of data, which would eventually slow down the application.Running Your Stripchart Application
After compiling and running your application, you should see a window with a continuously updating plot. The blue line will represent the generated data (a sine wave with some random noise in this example), scrolling from right to left as new data points are added. You can experiment with different data generation methods, timer intervals, and axis ranges to suit your specific needs.
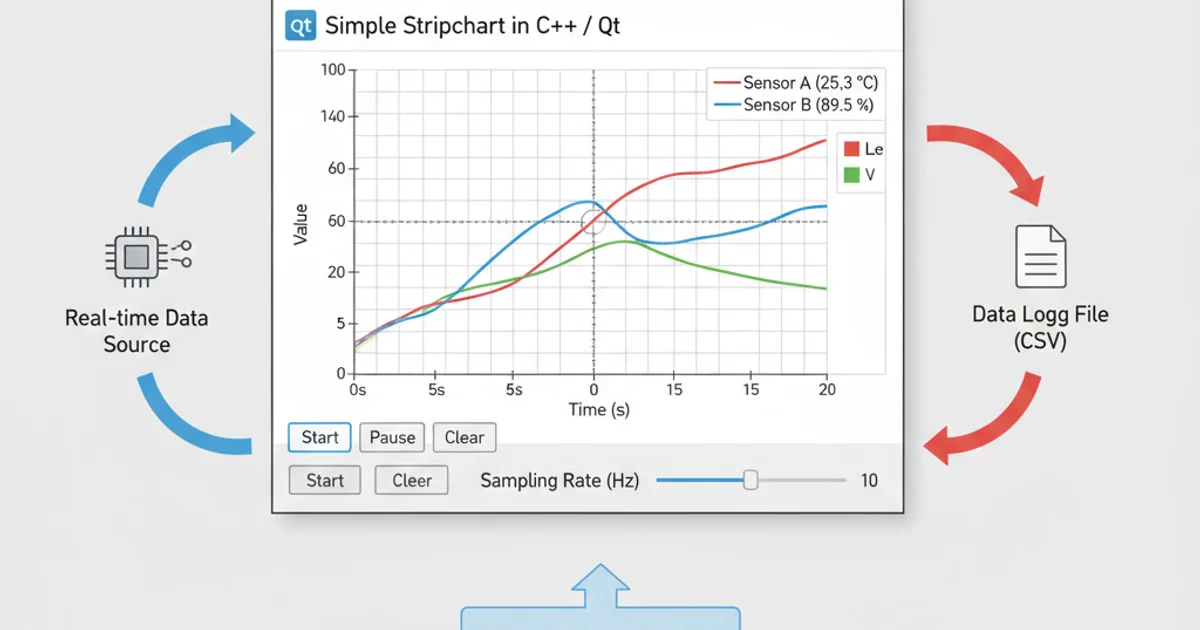
Example of the stripchart application in action.