logit regression and singular Matrix error in Python
Categories:
Resolving Singular Matrix Errors in Logit Regression with Statsmodels

Understand and troubleshoot the common 'singular matrix' error encountered when performing logistic regression using the statsmodels library in Python.
Logistic regression is a powerful statistical method for modeling binary outcomes. In Python, the statsmodels library is a popular choice for implementing these models. However, users often encounter a LinAlgError: Singular matrix or similar warnings during model fitting. This error indicates a fundamental problem with the data or model specification that prevents the algorithm from finding a unique solution. This article will delve into the causes of singular matrices in logistic regression and provide practical solutions to resolve them.
Understanding the Singular Matrix Error
At its core, a singular matrix error in logistic regression (or any generalized linear model) means that the design matrix (the matrix of independent variables) is not invertible. This typically happens when there's perfect multicollinearity among your predictor variables. In simpler terms, one or more of your independent variables can be perfectly predicted by a linear combination of other independent variables. When this occurs, the model's parameters cannot be uniquely estimated, leading to computational difficulties and the singular matrix error.
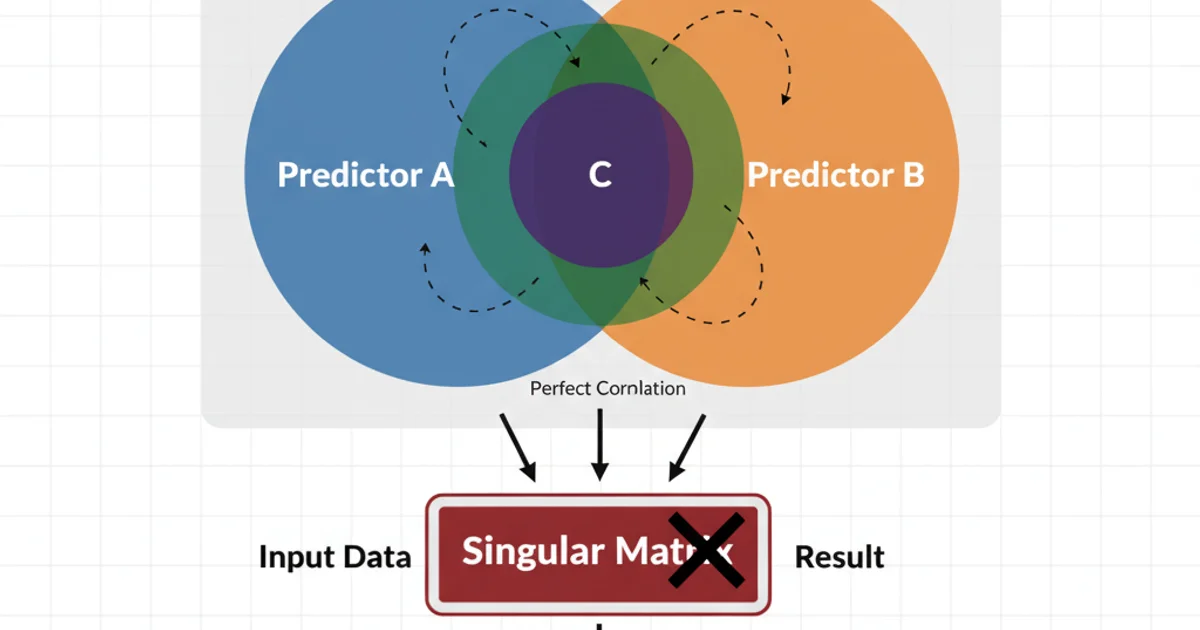
Conceptual illustration of perfect multicollinearity leading to a singular matrix.
Common Causes of Singular Matrices
Several scenarios can lead to perfect multicollinearity and, consequently, a singular matrix error:
- Perfect Multicollinearity: This is the most direct cause. If one predictor is a linear combination of others (e.g.,
X3 = X1 + X2), the matrix will be singular. - Dummy Variable Trap: When using categorical variables, if you include a dummy variable for every category and an intercept, you create perfect multicollinearity. One dummy variable is redundant.
- Redundant Variables: Including variables that are essentially the same or perfectly correlated (e.g., 'age in years' and 'age in months').
- Insufficient Variation: If a predictor variable has very little or no variation (e.g., it's constant for all observations, or nearly so), it can cause issues, especially with small sample sizes.
- Small Sample Size: With a very small number of observations relative to the number of predictors, it becomes easier for perfect or near-perfect multicollinearity to occur by chance.
Diagnosing and Resolving the Error
The key to resolving this error lies in identifying and addressing the source of multicollinearity. Here are several strategies:
1. Check for Constant Variables
Inspect your independent variables for any columns that have zero variance (i.e., all values are the same). These variables provide no information to the model and should be removed.
2. Address the Dummy Variable Trap
If you have a categorical variable with k categories, include only k-1 dummy variables in your model. statsmodels often handles this automatically if you use C() in your formula, but manual dummy creation requires careful attention.
3. Calculate Variance Inflation Factor (VIF)
VIF measures how much the variance of an estimated regression coefficient is inflated due to multicollinearity. High VIF values (typically > 5 or > 10) indicate problematic multicollinearity. You can iteratively remove variables with the highest VIF until the problem is resolved.
4. Perform Principal Component Analysis (PCA)
If you have many highly correlated predictors, PCA can transform them into a smaller set of uncorrelated principal components. These components can then be used as predictors in your logistic regression.
5. Feature Selection
Employ feature selection techniques (e.g., forward selection, backward elimination, LASSO regression) to identify and remove redundant or less important predictors.
6. Increase Sample Size
If feasible, increasing your sample size can sometimes alleviate issues related to near-perfect multicollinearity, especially when the number of predictors is high relative to observations.
import pandas as pd
import statsmodels.api as sm
from statsmodels.stats.outliers_influence import variance_inflation_factor

# Sample data with perfect multicollinearity
data = {
    'outcome': [0, 1, 0, 1, 0, 1, 0, 1, 0, 1],
    'feature1': [10, 12, 15, 10, 12, 15, 10, 12, 15, 10],
    'feature2': [20, 24, 30, 20, 24, 30, 20, 24, 30, 20],
    'feature3': [30, 36, 45, 30, 36, 45, 30, 36, 45, 30] # feature3 = feature1 + feature2
}
df = pd.DataFrame(data)

# Create a perfectly collinear feature
df['feature_sum'] = df['feature1'] + df['feature2']

# Define independent variables (X) and dependent variable (y)
X = df[['feature1', 'feature2', 'feature_sum']]
y = df['outcome']

# Add a constant to the independent variables for the intercept
X = sm.add_constant(X)

# Attempt to fit the logistic regression model (will likely fail or warn)
try:
    logit_model = sm.Logit(y, X)
    result = logit_model.fit()
    print(result.summary())
except Exception as e:
    print(f"Error fitting model: {e}")

print("\n--- VIF Calculation ---")
# Calculate VIF for each feature
vif_data = pd.DataFrame()
vif_data["feature"] = X.columns
vif_data["VIF"] = [variance_inflation_factor(X.values, i) for i in range(X.shape[1])]
print(vif_data)

print("\n--- Resolving Multicollinearity: Removing 'feature_sum' ---")
# Remove the collinear feature
X_resolved = df[['feature1', 'feature2']]
X_resolved = sm.add_constant(X_resolved)

# Fit the model again with resolved features
try:
    logit_model_resolved = sm.Logit(y, X_resolved)
    result_resolved = logit_model_resolved.fit()
    print(result_resolved.summary())
except Exception as e:
    print(f"Error fitting resolved model: {e}")
Python code demonstrating a singular matrix error due to perfect multicollinearity and its resolution using VIF.
Using statsmodels Formula API for Categorical Variables
When dealing with categorical variables, statsmodels' formula API (smf.logit) can often handle the dummy variable trap automatically by dropping one category as a reference. This is generally the recommended approach.
import pandas as pd
import statsmodels.formula.api as smf

# Sample data with a categorical variable
data = {
    'outcome': [0, 1, 0, 1, 0, 1, 0, 1, 0, 1],
    'feature_numeric': [10, 12, 15, 10, 12, 15, 10, 12, 15, 10],
    'category': ['A', 'B', 'C', 'A', 'B', 'C', 'A', 'B', 'C', 'A']
}
df_cat = pd.DataFrame(data)

# Using formula API, 'C(category)' handles dummy encoding and avoids the trap
# One category (e.g., 'A') will be dropped as the reference level automatically
try:
    logit_model_formula = smf.logit('outcome ~ feature_numeric + C(category)', data=df_cat)
    result_formula = logit_model_formula.fit()
    print(result_formula.summary())
except Exception as e:
    print(f"Error fitting formula model: {e}")

print("\n--- Manual Dummy Creation (Potential Trap) ---")
# Manual dummy creation - potential for dummy variable trap if all dummies + intercept are included
df_dummies = pd.get_dummies(df_cat['category'], prefix='cat', drop_first=False)
df_manual = pd.concat([df_cat[['outcome', 'feature_numeric']], df_dummies], axis=1)

X_manual = df_manual[['feature_numeric', 'cat_A', 'cat_B', 'cat_C']]
y_manual = df_manual['outcome']
X_manual = sm.add_constant(X_manual)

try:
    logit_model_manual = sm.Logit(y_manual, X_manual)
    result_manual = logit_model_manual.fit()
    print(result_manual.summary())
except Exception as e:
    print(f"Error fitting manual dummy model: {e}")
Demonstrating statsmodels formula API for categorical variables and the potential dummy variable trap with manual encoding.
drop_first=True in pd.get_dummies() or explicitly remove one dummy column to avoid the dummy variable trap. The statsmodels formula API (smf.logit) handles this automatically by default.