SonarQube - how is it used
Categories:
Leveraging SonarQube for Enhanced Software Quality

Explore how SonarQube integrates into the development lifecycle to continuously analyze code, detect bugs, vulnerabilities, and code smells, ensuring high-quality software.
SonarQube is an open-source platform developed by SonarSource for continuous inspection of code quality to perform automatic reviews with static analysis of code to detect bugs, code smells, and security vulnerabilities on 20+ programming languages. It integrates with existing workflows to enable continuous code quality and security analysis across your project branches and pull requests. This article will delve into its core functionalities, how it's typically used in a development pipeline, and best practices for maximizing its benefits.
What SonarQube Does
At its heart, SonarQube provides a centralized place to manage and track code quality. It goes beyond simple linting by offering deep static analysis capabilities. It identifies issues ranging from minor code style violations to critical security vulnerabilities and architectural flaws. The platform then presents these findings through a comprehensive dashboard, allowing development teams to understand the health of their codebase at a glance.
flowchart TD
    A[Developer Writes Code] --> B{Commit Code}
    B --> C[CI/CD Pipeline Triggered]
    C --> D[SonarScanner Executes Analysis]
    D --> E[Analysis Results Sent to SonarQube Server]
    E --> F[SonarQube Processes & Stores Results]
    F --> G[SonarQube Dashboard & Reports]
    G --> H{Quality Gate Check}
    H -->|Passed| I[Deployment]
    H -->|Failed| J[Developer Fixes Issues]
    J --> A
Typical SonarQube Integration Workflow
Integrating SonarQube into Your CI/CD Pipeline
The most effective way to use SonarQube is by integrating it directly into your Continuous Integration/Continuous Delivery (CI/CD) pipeline. This ensures that every code change is automatically analyzed, providing immediate feedback to developers. The process typically involves a 'SonarScanner' agent that runs as part of your build process, analyzes the code, and sends the results to the central SonarQube server. The server then processes these results, applies quality profiles and gates, and updates the project dashboard.
# Example of running SonarScanner in a CI/CD pipeline
# Assuming SonarScanner is installed and configured

# For Maven projects:
mvn clean verify sonar:sonar

# For Gradle projects:
gradle clean build sonarqube

# For .NET projects (using SonarScanner for MSBuild):
# 1. Begin analysis
SonarScanner.MSBuild.exe begin /k:"my-project-key" /d:sonar.host.url="http://localhost:9000"
# 2. Build your project
MSBuild.exe MyProject.sln /t:Rebuild
# 3. End analysis
SonarScanner.MSBuild.exe end

# Generic SonarScanner CLI (for other languages/build systems):
sonar-scanner \
  -Dsonar.projectKey=my-project-key \
  -Dsonar.sources=. \
  -Dsonar.host.url=http://localhost:9000 \
  -Dsonar.login=my-auth-token
Common SonarScanner commands for various build tools
Key Features and Benefits
SonarQube offers a rich set of features that contribute to improved software quality and maintainability:
- Quality Gates: Enforce quality standards by defining pass/fail criteria for code analysis.
- Quality Profiles: Customize rulesets to match your project's specific needs and coding standards (e.g., Checkstyle rules for Java).
- Multi-language Support: Analyze code in over 20 programming languages, including Java, C#, JavaScript, Python, PHP, and more.
- Vulnerability Detection: Identify security vulnerabilities and provide remediation guidance.
- Code Smells: Pinpoint maintainability issues that can lead to technical debt.
- Bug Detection: Automatically find common programming errors.
- Code Coverage: Integrate with testing tools to report on code coverage.
- Duplication Detection: Highlight duplicated code blocks to reduce redundancy.
- Historical Data & Trends: Track quality metrics over time to observe improvements or regressions.
- Integration with IDEs: SonarLint, a companion tool, provides real-time feedback directly in your IDE.
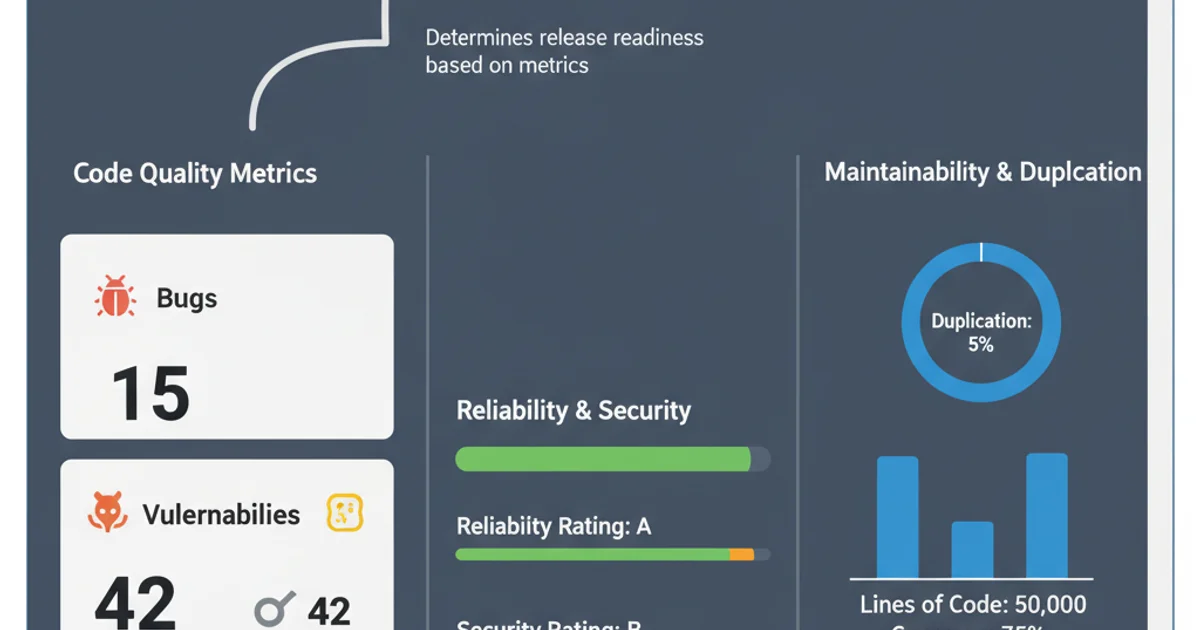
SonarQube project dashboard providing an overview of code quality.
Best Practices for Effective SonarQube Usage
To get the most out of SonarQube, consider these best practices:
- Start Early: Integrate SonarQube from the beginning of a project to prevent technical debt from accumulating.
- Customize Quality Profiles: Adapt the default quality profiles to your team's coding standards and project requirements. Don't just use the defaults.
- Enforce Quality Gates: Make Quality Gates mandatory in your CI/CD pipeline. This ensures that only code meeting your quality standards proceeds.
- Educate Your Team: Ensure developers understand the issues reported by SonarQube and how to fix them. Regular training can be beneficial.
- Focus on New Code: Prioritize fixing issues in 'new code' (code changed since the last analysis) to prevent new technical debt.
- Review Dashboards Regularly: Project leads and developers should regularly review the SonarQube dashboard to monitor trends and address critical issues promptly.
- Use SonarLint: Encourage developers to use SonarLint in their IDEs for instant feedback, catching issues before they even reach the CI/CD pipeline.