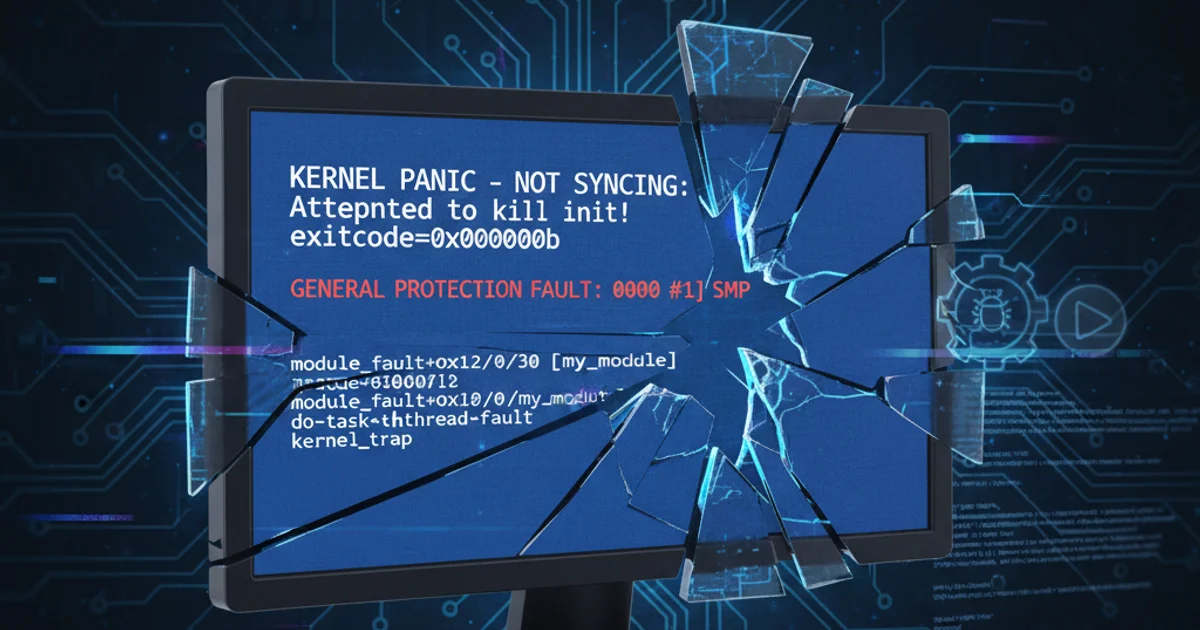
Linux kernel module crash debug: general protection fault: 0000 [#1] SMP
Categories:
Debugging Linux Kernel Module General Protection Faults
Understand and resolve 'general protection fault: 0000 [#1] SMP' errors in Linux kernel modules, a common and critical kernel crash.
Developing Linux kernel modules requires meticulous attention to detail, as even a small error can lead to a system-wide crash. One of the most common and critical errors encountered is the 'general protection fault: 0000 [#1] SMP'. This fault indicates that your kernel module has attempted an operation that violates the CPU's protection mechanisms, such as accessing invalid memory, executing non-executable memory, or using an invalid segment selector. This article will guide you through understanding, diagnosing, and debugging these challenging kernel crashes.
Understanding General Protection Faults (GPF)
A General Protection Fault (GPF) is a type of exception raised by the CPU when a program violates the processor's protection rules. In the context of the Linux kernel, this often means a kernel module has done something illegal. The '0000' in the error message typically refers to the error code pushed onto the stack by the CPU, which can sometimes provide more specific details about the nature of the fault, though '0000' often means no specific sub-error code was generated or it's a generic protection violation. The '[#1] SMP' indicates that this is the first crash on a Symmetric Multi-Processing (SMP) system, meaning a multi-core or multi-processor machine.
flowchart TD
    A[Kernel Module Execution] --> B{Invalid Memory Access?}
    B -- Yes --> C[GPF Triggered]
    B -- No --> D[Continue Execution]
    C --> E[CPU Raises Exception]
    E --> F[Kernel Exception Handler]
    F --> G[Print Stack Trace/Registers]
    G --> H[Kernel Panic/System Halt]
    H --> I[Reboot/Debug]
Flow of a General Protection Fault in the Linux Kernel
Common Causes of GPFs in Kernel Modules
GPFs in kernel modules are almost always due to programming errors. Identifying the root cause requires careful analysis of the crash dump and the module's source code. Here are some of the most frequent culprits:
- Null Pointer Dereference: Attempting to access memory through a
NULLpointer. This is perhaps the most common cause. - Use-After-Free: Accessing memory that has already been freed. This can lead to data corruption or accessing memory that has been reallocated for another purpose.
- Out-of-Bounds Access: Reading from or writing to memory outside the allocated buffer. This can corrupt adjacent data or attempt to access protected memory.
- Invalid Kernel Address Access: Trying to access user-space memory directly without proper kernel functions (
copy_from_user,copy_to_user) or attempting to access kernel memory that is not mapped or is protected. - Stack Overflow: Recursion or large local variables consuming too much kernel stack space.
- Incorrect Locking: Race conditions or deadlocks that lead to corrupted data structures or invalid state, which then causes an invalid memory access.
- Uninitialized Variables: Using a pointer or variable before it has been assigned a valid value.
Debugging Strategies and Tools
Debugging a kernel crash can be challenging because the system is often in an unstable state. The key is to gather as much information as possible from the crash dump.
- Analyze the Stack Trace: The most crucial piece of information is the stack trace printed during the panic. It shows the sequence of function calls leading up to the fault. Look for your module's functions in the trace.
- Examine Registers: The CPU registers (e.g.,
RIP,RSP,CR2) at the time of the fault can provide clues.RIP(Instruction Pointer) points to the instruction that caused the fault.CR2is particularly useful for page faults, as it holds the address that caused the fault. - Use
dmesgandsyslog: After a reboot, checkdmesgoutput or/var/log/syslogfor the full kernel panic message. It often contains more context than what flashes on the screen. crashUtility: For more in-depth analysis, especially withkdumpenabled, thecrashutility is invaluable. It allows you to analyze kernel crash dumps offline, inspect memory, variables, and stack traces.printkDebugging: While not ideal for production, liberal use ofprintkstatements can help narrow down the exact line of code causing the issue. UseKERN_DEBUGorKERN_INFOlevels.- Memory Sanitizers (KASAN): The Kernel Address Sanitizer (KASAN) is a powerful tool built into the kernel that can detect various memory errors like use-after-free, out-of-bounds access, and double-free. Enabling KASAN during development can catch many issues proactively.
- Static Analysis Tools: Tools like
sparsecan help find potential issues in your kernel module code before compilation.
#include <linux/module.h>
#include <linux/kernel.h>
#include <linux/init.h>
#include <linux/slab.h>

static int *bad_ptr = NULL;

static int __init gpf_module_init(void)
{
    printk(KERN_INFO "GPF module loaded\n");
    // This will cause a General Protection Fault (Null Pointer Dereference)
    *bad_ptr = 10;
    return 0;
}

static void __exit gpf_module_exit(void)
{
    printk(KERN_INFO "GPF module unloaded\n");
}

module_init(gpf_module_init);
module_exit(gpf_module_exit);

MODULE_LICENSE("GPL");
MODULE_AUTHOR("Your Name");
MODULE_DESCRIPTION("A simple kernel module to demonstrate GPF");
Example of a kernel module designed to cause a Null Pointer Dereference GPF.
1. Compile the Module
Compile your kernel module using a Makefile similar to this:
obj-m += gpf_module.o

all:
\tmake -C /lib/modules/$(shell uname -r)/build M=$(PWD) modules

clean:
\tmake -C /lib/modules/$(shell uname -r)/build M=$(PWD) clean
2. Insert the Module
Load the module using sudo insmod gpf_module.ko. This will immediately trigger the GPF and crash your system.
3. Analyze the Crash
After the system reboots, use dmesg | less or journalctl -k to view the kernel logs. Look for the 'general protection fault' message and the accompanying stack trace. You should see your module's function (gpf_module_init) in the trace, indicating the source of the problem.