Creating Bins/groups in Excel
Categories:
Creating Bins and Groups in Excel for Data Analysis
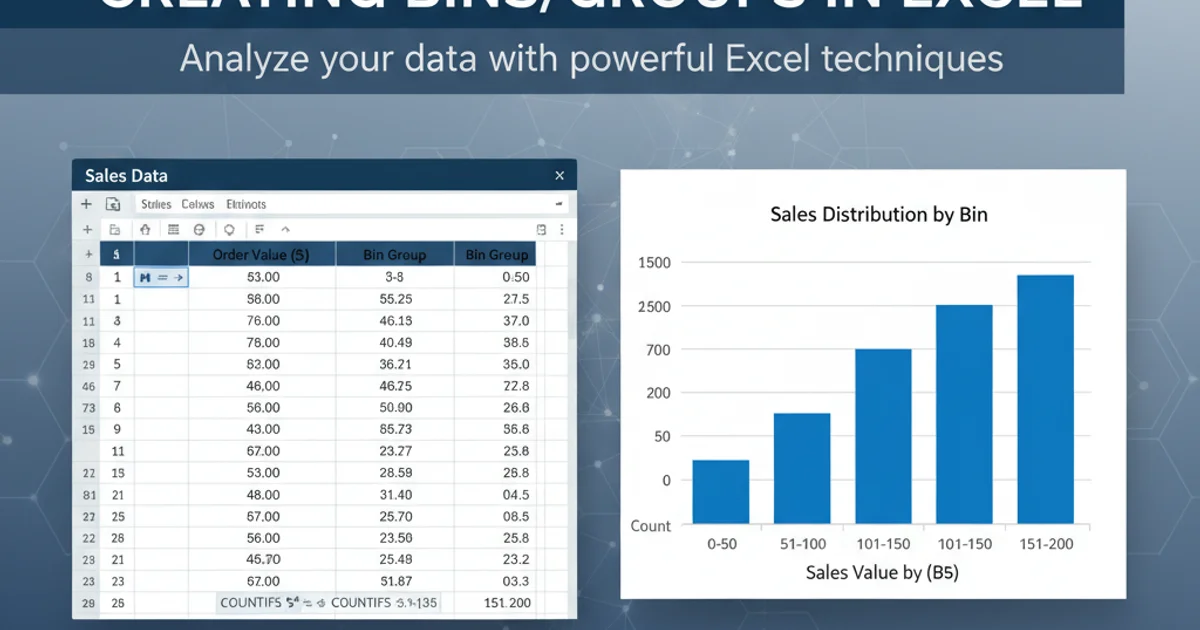
Learn various methods to categorize and group your data into bins in Excel, from simple formulas to advanced PivotTable features, enhancing your data analysis capabilities.
Grouping data into bins (also known as bucketing or categorizing) is a fundamental step in data analysis. It allows you to transform continuous data into discrete intervals, making it easier to identify patterns, distributions, and trends. Excel offers several powerful ways to achieve this, catering to different levels of complexity and data structures. This article will guide you through the most common and effective methods.
Method 1: Using IF Statements for Simple Binning
For straightforward binning based on specific criteria, Excel's IF function is a versatile tool. You can nest multiple IF statements to create several bins. This method is best for a small number of bins or when your bin boundaries are clearly defined and not subject to frequent change.
=IF(A2<50,"Low",IF(A2<100,"Medium","High"))
Example of a nested IF statement to categorize values in cell A2 into 'Low', 'Medium', or 'High' bins.
IF statements, always arrange your conditions from the most restrictive to the least restrictive (e.g., <50 then <100) to ensure correct categorization.Method 2: Using VLOOKUP or XLOOKUP with a Bin Table
For more complex binning scenarios, especially when you have many bins or need to easily adjust bin boundaries, using VLOOKUP (or XLOOKUP in newer Excel versions) with a separate bin lookup table is highly efficient. This method centralizes your bin definitions, making them easy to manage and update.
First, create a bin table with two columns: the lower bound of each bin and the corresponding bin label. Ensure the lower bounds are sorted in ascending order.
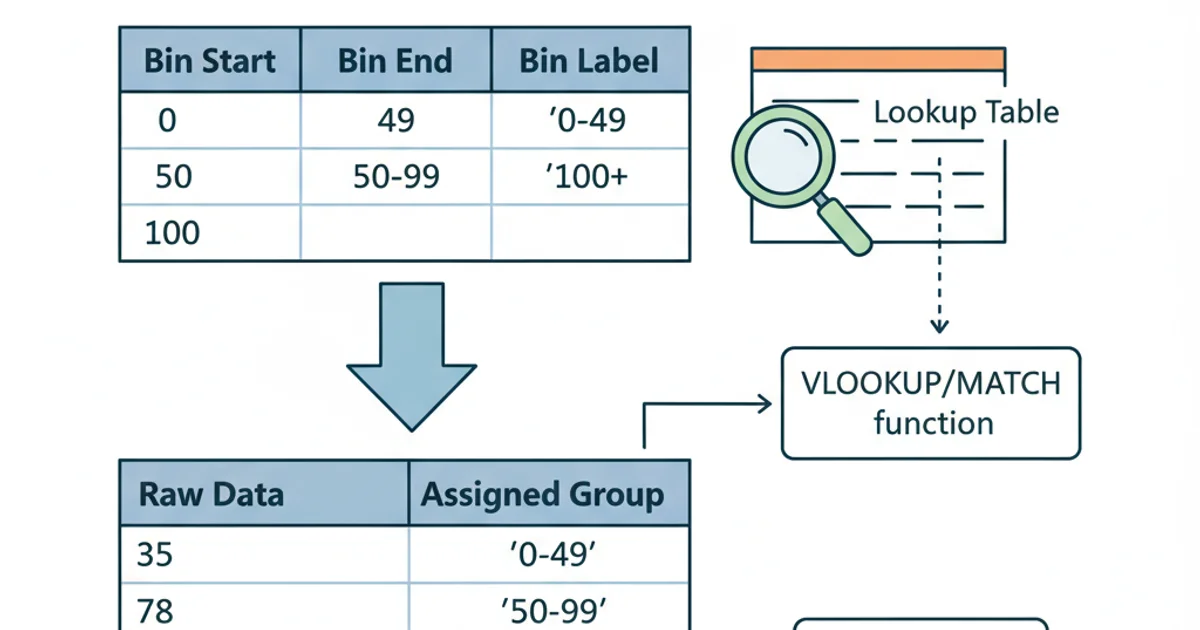
Example of a bin lookup table.
=VLOOKUP(A2,$D$2:$E$5,2,TRUE)
Using VLOOKUP with the TRUE argument for approximate match to find the correct bin for the value in A2 based on the bin table in D2:E5.
=XLOOKUP(A2,$D$2:$D$5,$E$2:$E$5,"Not Found",-1)
Using XLOOKUP with the match_mode set to -1 (exact match or next smaller item) for binning.
Method 3: Grouping in PivotTables
PivotTables offer the most dynamic and interactive way to create bins and groups, especially for numerical and date data. This method is ideal for exploratory data analysis, as you can quickly change bin sizes and see the impact on your aggregated data.
1. Create a PivotTable
Select your data range, go to the 'Insert' tab, and click 'PivotTable'. Choose where to place the PivotTable (e.g., 'New Worksheet').
2. Add Field to Rows
Drag the numerical or date field you want to bin (e.g., 'Sales', 'Date') to the 'Rows' area of the PivotTable Fields pane.
3. Group the Field
Right-click on any value in the row labels of your PivotTable. Select 'Group...'. For numerical data, Excel will suggest a starting value, ending value, and an interval (bin size). Adjust these as needed. For date data, you can group by seconds, minutes, hours, days, months, quarters, or years.
4. Add Value Field
Drag the same field (or another relevant field) to the 'Values' area to count or sum the items within each bin.
flowchart TD
    A["Raw Data (e.g., Sales Figures)"] --> B["Insert PivotTable"]
    B --> C["Drag 'Sales' to Rows"]
    C --> D["Right-click 'Sales' in PivotTable"]
    D --> E["Select 'Group...'"]
    E --> F{"Set Starting, Ending, and By values"}
    F --> G["Drag 'Sales' to Values (Count/Sum)"]
    G --> H["PivotTable with Binned Data"]
    H --> I["Analyze Trends & Distributions"]
    style F fill:#f9f,stroke:#333,stroke-width:2px
Workflow for creating bins using PivotTables in Excel.
Method 4: Using the Analysis ToolPak (Histogram)
The Analysis ToolPak, an Excel add-in, includes a Histogram tool that can automatically create bins and count data points within those bins. This is particularly useful for statistical analysis and visualizing data distribution.
1. Enable Analysis ToolPak
Go to 'File' > 'Options' > 'Add-ins'. Select 'Excel Add-ins' from the 'Manage' dropdown and click 'Go...'. Check 'Analysis ToolPak' and click 'OK'.
2. Define Bin Ranges
In a separate column, list the upper limits for your desired bins. For example, if you want bins 0-10, 11-20, 21-30, your bin range would be 10, 20, 30.
3. Run Histogram Tool
Go to the 'Data' tab and click 'Data Analysis' (in the 'Analysis' group). Select 'Histogram' and click 'OK'.
4. Configure Histogram Options
In the Histogram dialog box, specify your 'Input Range' (the data you want to bin) and your 'Bin Range' (the upper limits you defined). Choose an 'Output Range' or 'New Worksheet Ply' for the results. Optionally, check 'Chart Output' to generate a histogram chart.